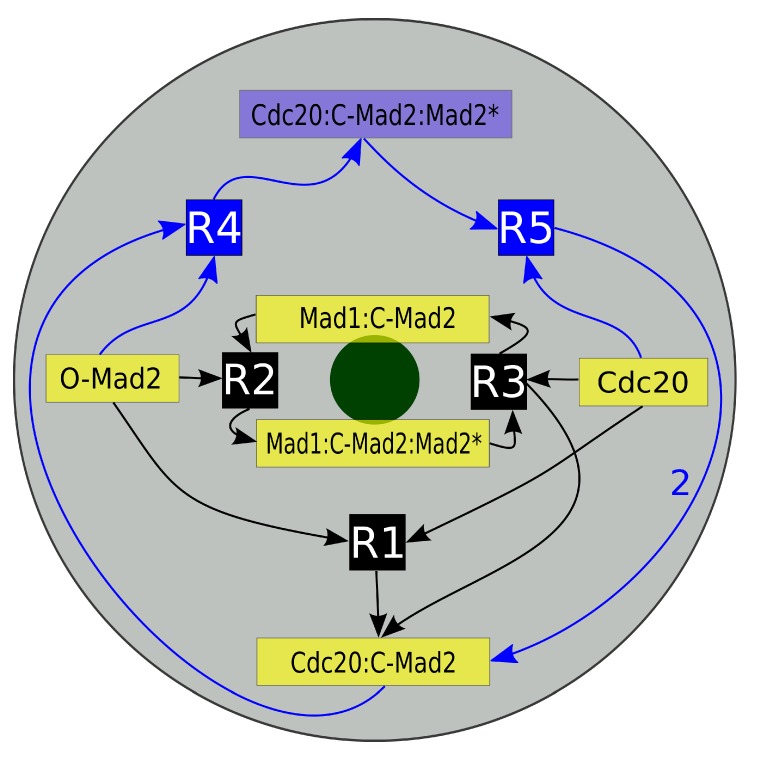
Figure 2.
Schematic diagram of the “Mad2 template” model. Depicted is a projection of our mitotic cell. The gray disk corresponds to the cell while the green disk presents the last unattached kinetochore. Inscribed is the reaction network of the “Mad2 template” model with species localization. The core model consists of five species (yellow boxes) and their three reactions (black boxes R1, R2 and R3). The full model furthermore contains the amplification pathway, which is symbolized by the blue boxes (Cdc20:C-Mad2:Mad2*, R4 and R5). The arrows’ directions indicate whether a species is a reactant or a product. Mad1:C-Mad2 and Mad1:C-Mad2:Mad2* are localized predominantly in the vicinity of the kinetochore and the later catalyzes reactions R2 and R3. The autocatalytic amplification reactions of Cdc20:C-Mad2 occur in the cytosol (see Section 2 for details).

