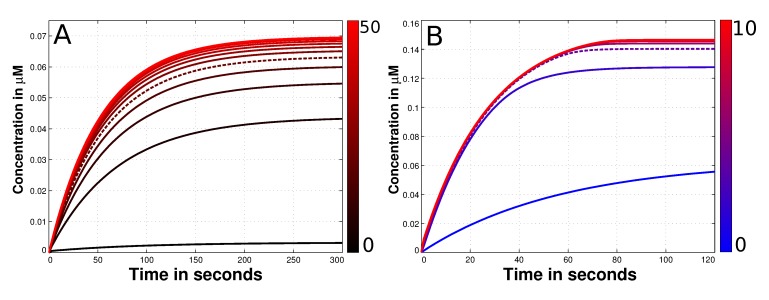
Figure 3.
Diffusion and convection parameter estimation of the species O-Mad2. (A) Depicted is the time dependent concentration of Cdc20:C-Mad2 with different diffusion constants of O-Mad2. The variation of this rate is shown next to the plot with the color gradient. The black curve denotes a slow diffusion (0 µm2s−1) while red curves present fast diffusion values (up to 50 µm2s−1). At the end of the simulations it is a maximum of 0.07 µM of the Cdc20:C-Mad2 complex formed. If the diffusion constant Di is greater than 20 µm2s−1 no significant alteration can be observed in terms of produced Cdc20:C-Mad2. Thus, we used this value for all other simulations (dashed line); (B) presented is again the time dependent concentration of Cdc20:C-Mad2. This time the convection rate of O-Mad2 is varied according to the color gradient. The blue curve has no convection and consequently is the same like the dashed plot in panel A. Red curves have a convection up to 10 µms−1. Exceeds the convection 4 µm2s−1, no alteration of the formed Cdc20:C-Mad2 can be observed in steady state. As a result we used this value for the force, transporting O-Mad2 towards the spindle mid-zone.

