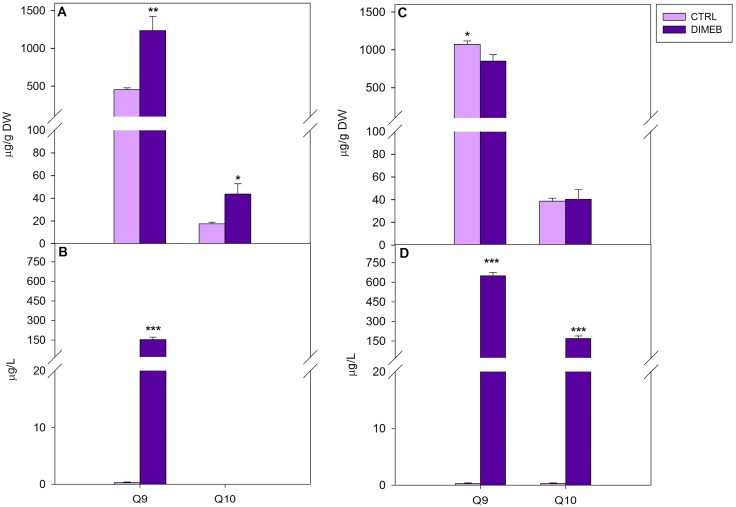
Figure 2.
Intracellular and extracellular quinone levels in A. annua cell cultures untreated (CTRL) or treated (DIMEB) with 50 mM DIMEB. Data are expressed as mean ± standard deviation from three independent experiments, * p < 0.05; ** p < 0.01; *** p < 0.001 in comparison with control assessed by Anova-one-way post hoc Holm-Sidak test. Intracellular (A) and extracellular (B) quinone levels after three days of treatment; intracellular (C) and extracellular (D) quinone levels after seven days of treatment.

