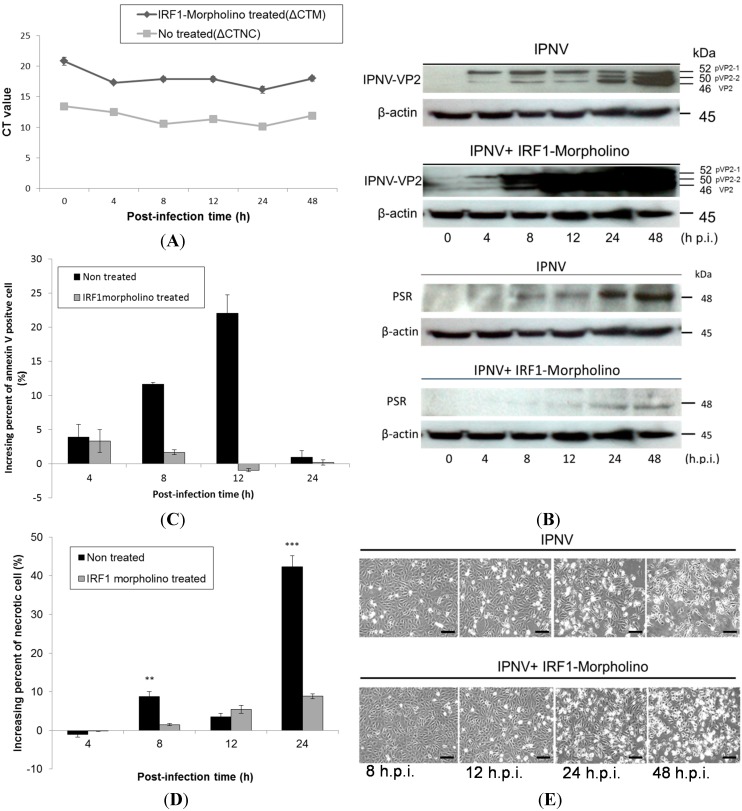
Figure 6.
Effects of IRF-1 knockdown on CHSE-214 cells during IPNV infection. (A) Real-time qPCR was used to determine the mRNA levels of IRF-1 with or without IRF-1 morpholino treatment following IPNV infection (MOI = 1). Expression were normalized to the internal control (β-actin) and is shown as the ΔCt value. The results indicated that IRF-1 mRNA expression was inhibited by approximately 38% with the morpholino; (B) Immunoblots of PSR or IPNV-VP2 expressionin IPNV-infected CHSE-214 cells (MOI = 1); The upper panels of (B) show the expression without IRF-1 morpholino treatment during infection, and the lower panels show the expression with IRF-1 morpholino treatment (10 μM, 18 h incubation) during infection. Lanes 1–6 correspond to 0, 4, 8, 12, 24 and 48 h.p.i., respectively (0 h as positive control, β-actin as internal control). PSR expression exhibited a delay in IRF-1 knockdown CHSE-214 cells compared to the control group (non-morpholino treated), whereas the IPNV viral protein VP2 dramatically increased in the same cells during IPNV infection; (C,D) Flow cytometry to analyze apoptosis or necrosis in CHSE-214 cells during IPNV infection. The data indicated that PS-positive cells and necrotic cells decreased in IRF-1 knockdown CHSE-214 cells (** p < 0.01; and *** p < 0.0001); and (E) Cell death was inhibited in IRF-1 knockdown CHSE-214 cells (lower panel), compared with control (upper panel) after IPNV infection (scale bar = 100 μm).

