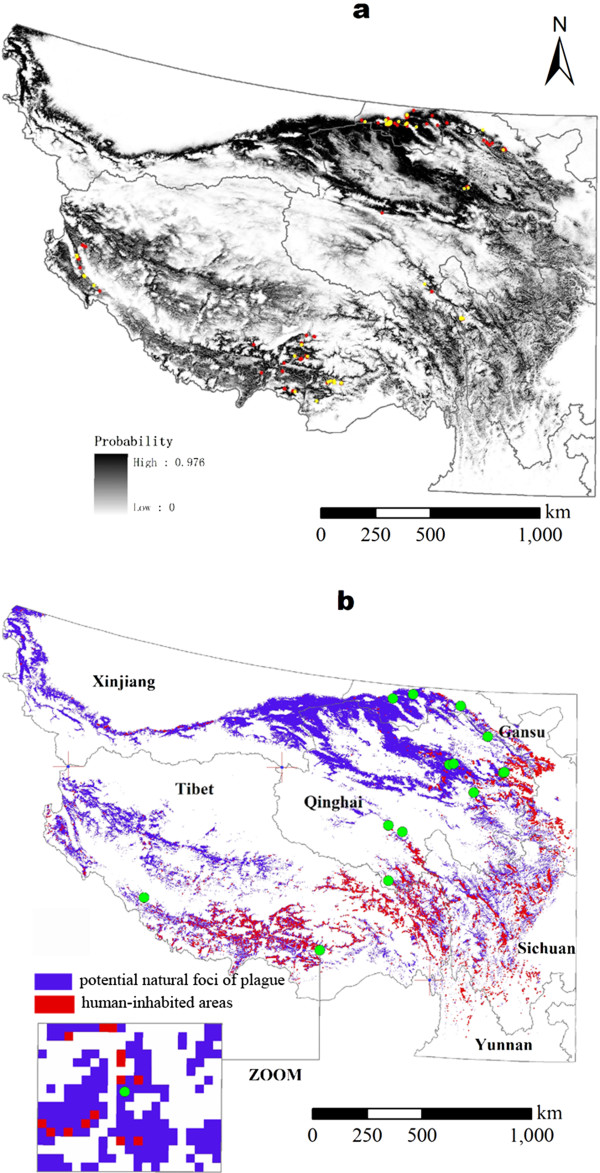
Figure 2.

Risk map of natural foci of plague in Qinghai-Tibetan Plateau. Panel a: Probability of natural foci of plague. 164 presence points (red circles) for training model and 54 presence points (yellow circles) for testing model are overlaid on the map. Panel b: Potential natural foci of plague (blue pixels) and human-inhabited areas (red pixels) in them. 16 sites of human plague cases from 2004 to 2010 (green circles) are overlaid on the map.
