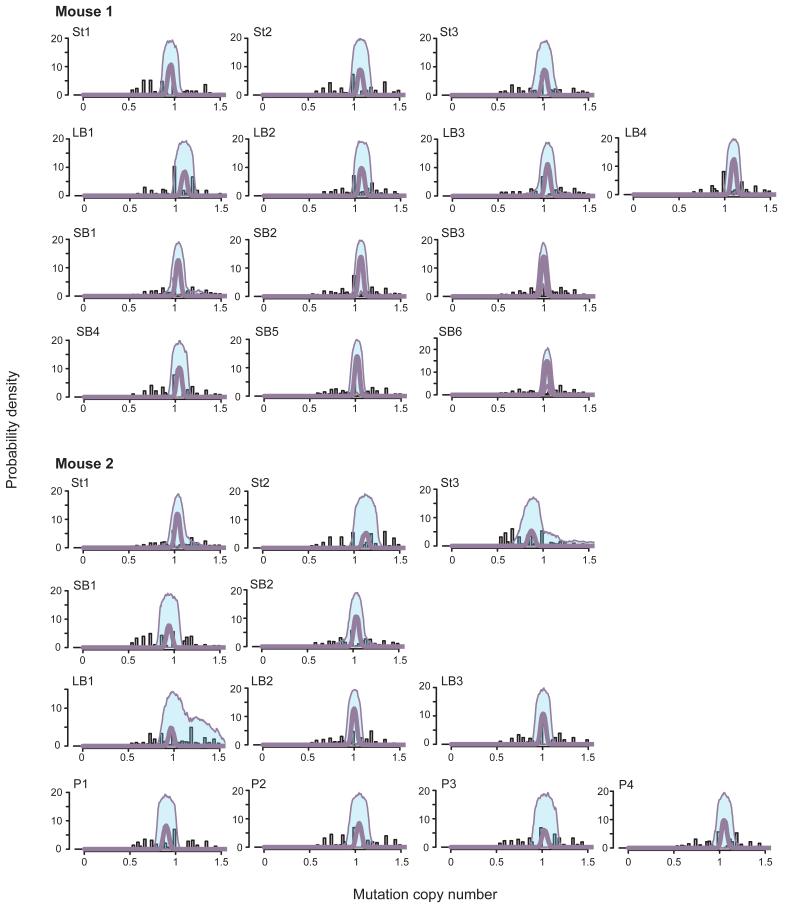
Extended data figure 1. Mutant read count frequencies and clonality of organoids.
Using the Dirichlet process to analyse the mutant read count frequencies, we determined the clonality of each organoid. In every organoid only one clone can be found, with no evidence of subclonality. The single clone of each organoid presents with variants that are heterozygous (mutation copy number of 1). The shaded area represents the 95% confidence interval around each peak. Y-axis: Probability density. X-axis: mutation copy number. Identifier in top left corner of each graph is the sample ID. St: stomach. SB: small bowel. LB: large bowel. P: prostate.

