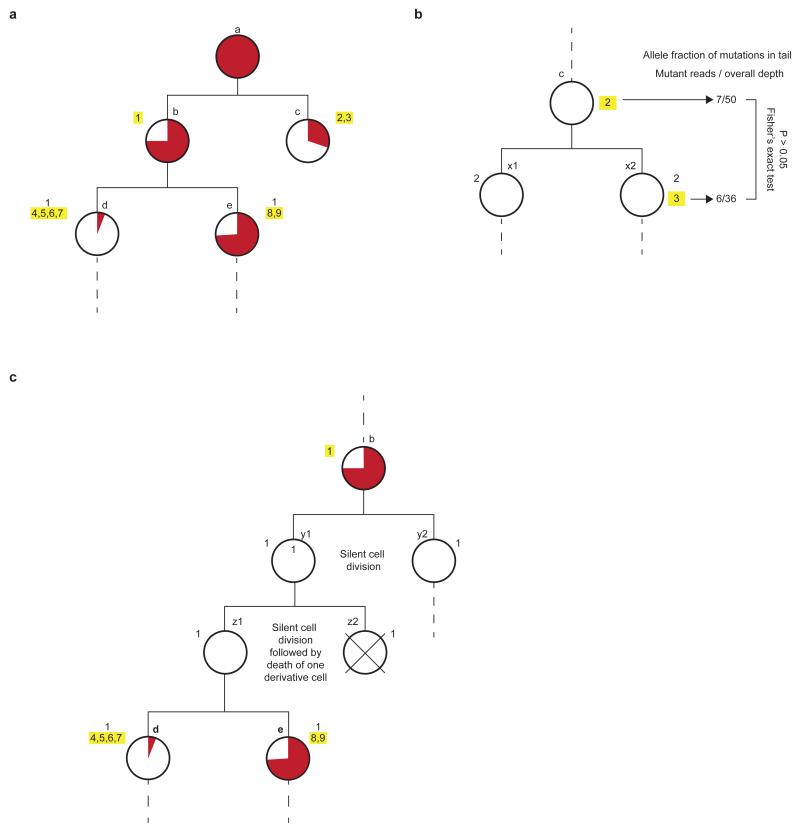
Extended data figure 3. Principles of parsimonious construction of cell division trees.
a, First two cell division of mouse 1. Each white-filled large circle represents an embryo cell that is defined by a unique combination of mutations. Each mutation is represented by a number next to the white circles, and yellow highlights mutation(s) acquired during the most recent mitosis. Letters next to white circles are identifiers of each embryonic precursor cell. The proportional contribution of each embryonic precursor cell to the population of cells in the tail is represented by the proportion of the circle area coloured red, assessed by read counts, in the tail, of the most recently acquired mutation(s) in each embryo cell. b, Note that cells ‘c’, ‘d’, and ‘e’ are defined by more than one mutation which may have occurred in successive cell divisions rather than in a single cell division, as illustrated here for cell ‘c’. As the allele fractions of these mutations “2” and “3” in the tail are not significantly different, the mutations can be interpreted as having occurred during the same cell division. The limited depth of these mutations in the tail, however, may not provide sufficient power to detect small, but real, significant differences so we cannot exclude the possibility that these mutations occurred in successive cell divisions. c, Possibility of “silent” division and cell death. It is possible that any number of “silent” cell divisions (in which no mutation took place) occurred which we did not capture because of the lack of detectable mutations. In the hypothetical scenario illustrated here, two such silent divisions took place between precursor ‘b’ and ‘d’/‘e’. The existence of “silent” cell divisions can be tested by comparing the tail allele frequencies of a precursor cell with the sum of the allele frequencies of the two derivative cells, which should be similar. In the example illustrated here, the combined tail allele fractions of mutations defining ‘d’ and ‘e’ are not significantly different from mutation 1 of cell ‘b’. The tail allele fraction of mutation 1 is 37.5 % and the combined allele fraction of mutations 4 to 9 is 39.8%. These observations are therefore compatible with our hypothesis that cell ‘b’ is the immediate precursor of cells ‘d’ and ‘e’. Again, however, lack of statistical power through limited coverage may limit our ability to detect these differences. Moreover, if a cell division results in one daughter with no mutations and the other daughter dies and does not contribute to the adult, then we will be unable to detect the existence of this cell division, illustrated here in cells ‘z1’ and ‘z2’.

