
Figure 1.
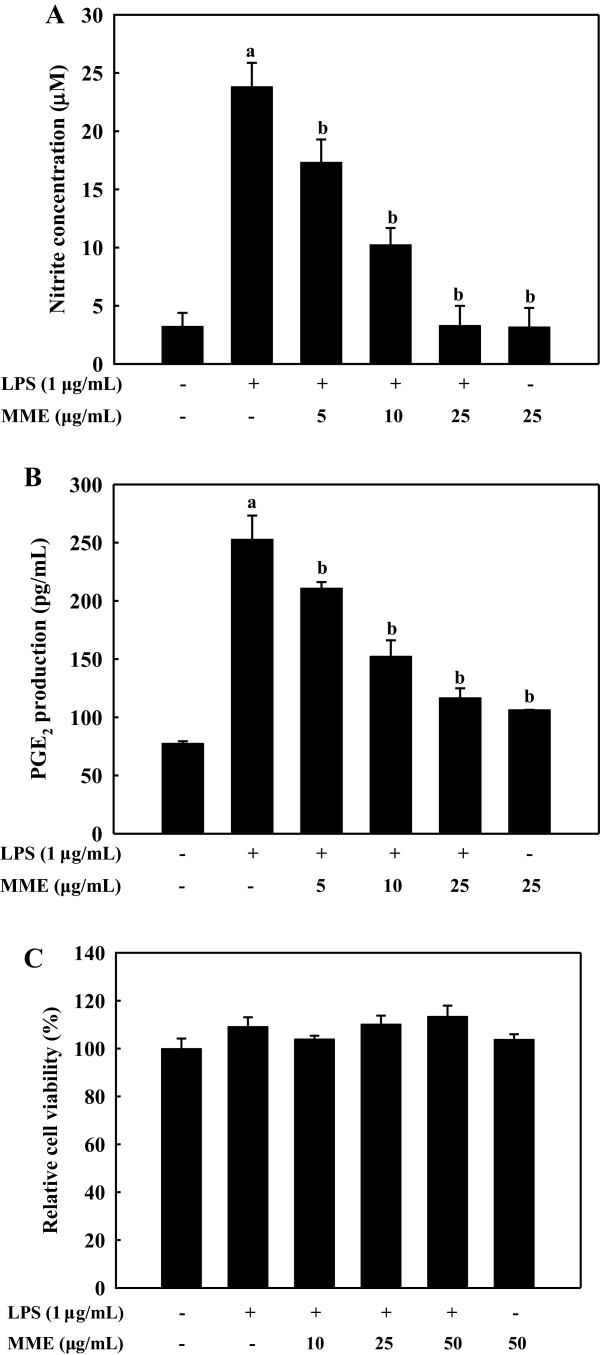
Effect of MME on LPS-induced NO and PGE2 production in BV-2 cells. BV-2 cells pretreated with different concentrations of MME for 2 h were stimulated with LPS (1 μg/mL) for 24 h. The treated culture media were used to assay the amount of NO (A) and PGE2 production (B). BV-2 microglial cells were treated with various concentration of MME in the absence or presence of LPS (1 μg/mL). After 24 h, cell viability was measured by MTS assay (C). Data are presented as means ± SDs of three independent experiments. ap < 0.05 indicates significant differences compared to the non-treated group. bp < 0.05 indicates significant differences compared to the LPS-only group.