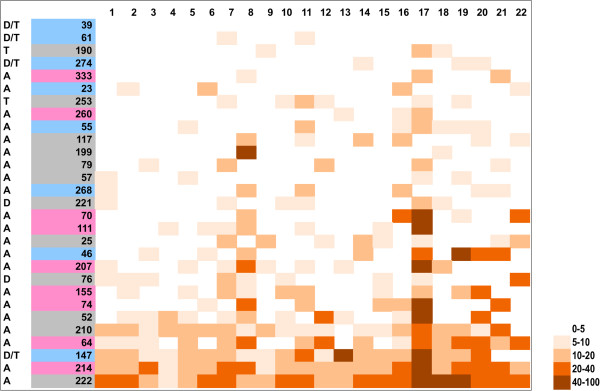
Figure 5.

Densities of breakpoints on individual chromosomes in all tumors. Heat map showing distribution of breakpoints within genomes. Total number of breakpoints per each chromosome was normalized to the size of the chromosome and it is expressed as numbers of breaks per 100 Mb. Tumors are aligned from the least aberrant (top) to the most aberrant (bottom). Tumor ploidies are indicated on the left: tumors with diploid flow sorting profiles are marked as follows: diploid tumors (D), tetraploid tumor (T), diploid or tetraploid (D/T); tumors with aneuploid flow sorting profiles are marked with A. The color code in the tumor number column corresponds to the clinical subtype: blue = ER+; pink = HER2+; grey = TNBC.
