
Figure 3.
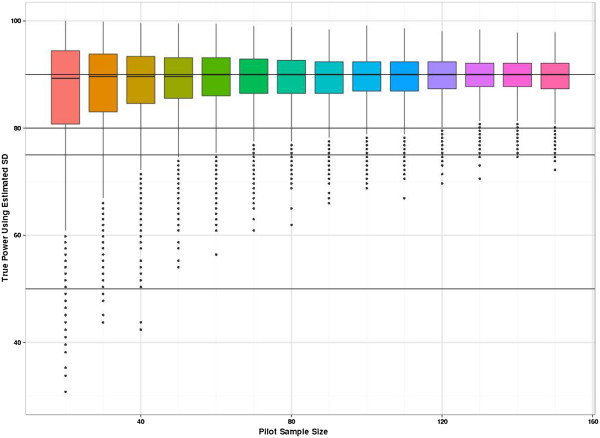
Distribution of planned RCT study power when using the SDpestimate derived from the pilot study. The planned study size is used to calculate the true power if SD = 1 is assumed. The graph shown is for a true effect size of 0.2. The vertical axis is true power. The x-axis shows the size of the two-arm pilot study.