
Figure 4.
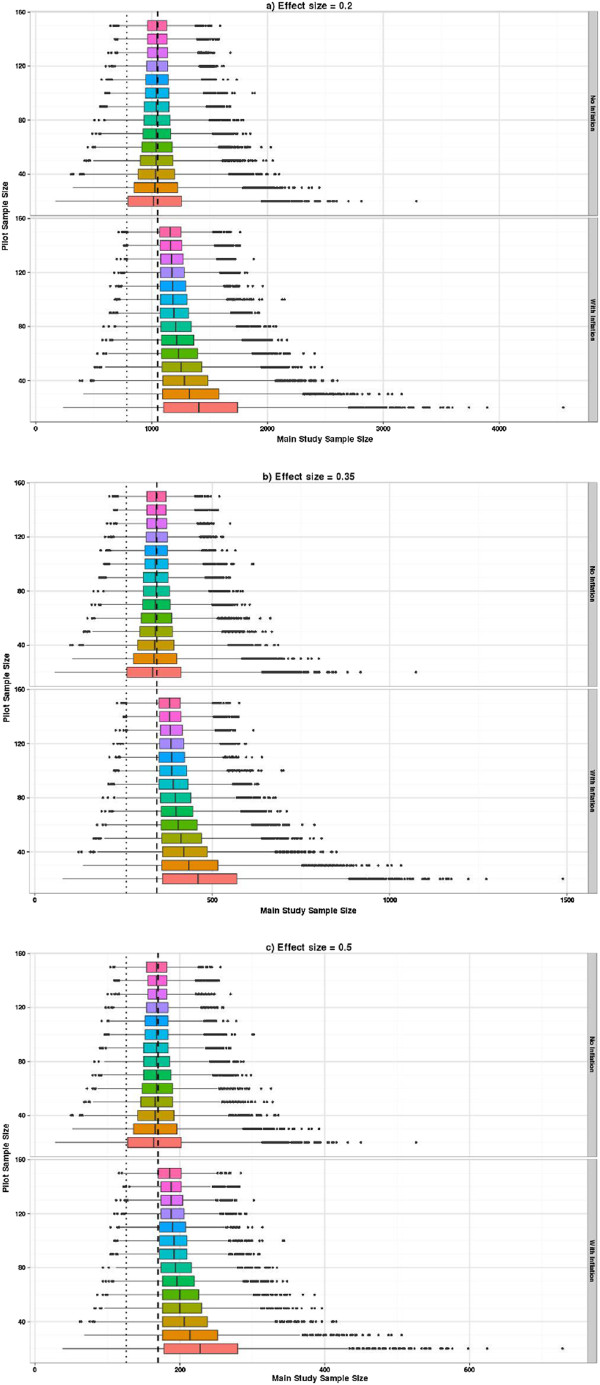
Distribution of planned sample sizes using crude SDp estimates and adjusting for a specified level of confidence. (a) Effect size = 0.2. (b) Effect size = 0.35. (c) Effect size = 0.5. The upper part of each graph shows the distribution of planned sample sizes by pilot study size. The lower part shows the same but using the inflation adjustment to guarantee the specified power with 80% confidence. The x-axis shows the planned sample size and the vertical axis shows the pilot study size. The dashed vertical line shows the sample size associated with a true power of 90% and the dotted line for 80%.