
Figure 7.
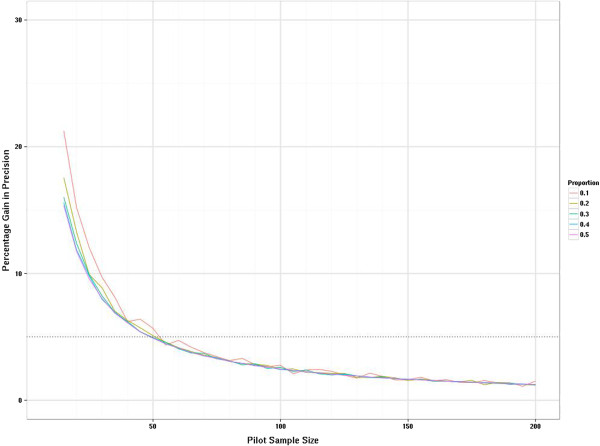
Distribution of relative gain in precision for binary outcomes as pilot study size increases. This graph compares the width of the confidence intervals for n + 5 subjects and n subjects. This is scaled by the width of the interval when there are n subjects.