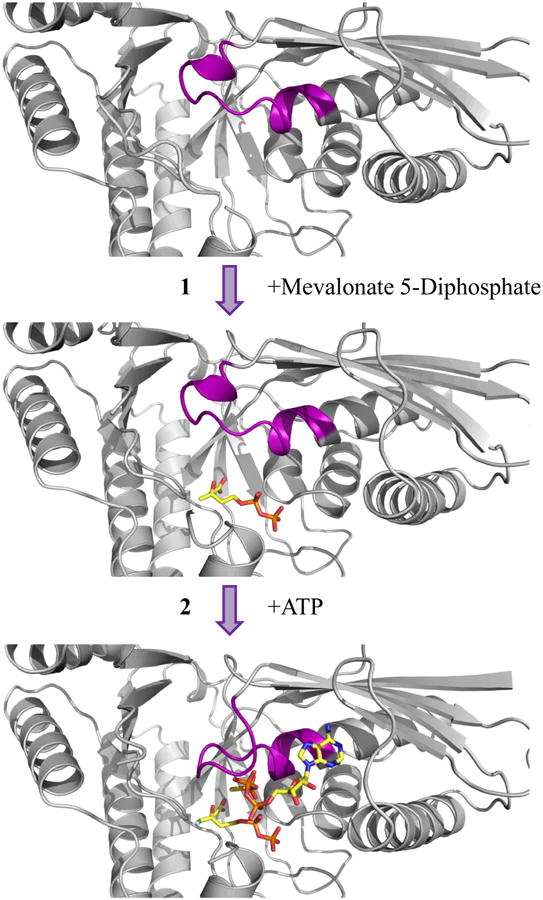
Figure 4.

Sequential binding of substrate and nucleotide within the active site of MDD. Top, Cartoon ribbon diagram of apo-MDD (gray). Middle, Cartoon ribbon diagram of MDD (gray) in complex with the substrate MVAPP (ball and stick, yellow). Bottom, Cartoon ribbon diagram of MDD (gray) in complex with the inhibitor FMVAPP and nucleotide analog ATPγS (ball and stick, yellow). Within all three panels, the conserved ‘P-loop’ sequence (PTXaaaGLASSAS) is colored purple. The conformational change within the ‘P-loop’ occurs after both substrate and nucleotide have bound the enzyme active site.
