
Figure 6.
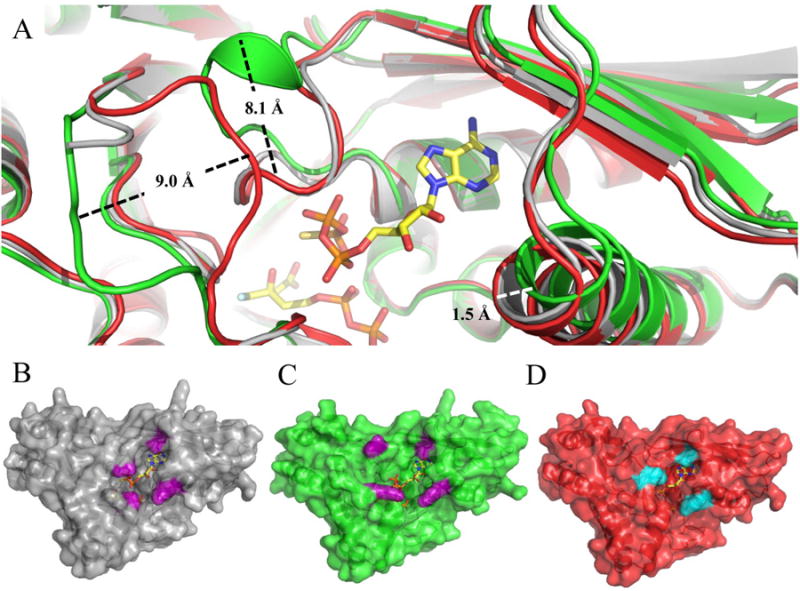
Structural alignment of ternary wild type and mutant MDD co-crystal structures. (A) Cartoon ribbon diagram of the structural alignment of WT MDD (gray) in complex with the inhibitor FMVAPP and nucleotide analog ATPγS (ball and stick, yellow), S192A MDD (green) in complex with the inhibitor FMVAPP and nucleotide analog ATPγS (not shown for clarity) and D283A MDD (red) in complex with the substrate MVAPP and nucleotide analog ATPγS (not shown for clarity). Measured conformational changes between the S192A and D283A MDD mutants are depicted; distances were measured from equivalent amino acid Cα atoms. (B) Surface representation of ternary WT MDD co-crystal structure (gray). Area of active site ‘funnel’ (∼145 Å2) measured from Ala101 Cβ to Lys68 Cs (10.5 Å) and Ser191 Cα to Leu60 CD2 (13.8 Å), side chains colored purple. (C) Surface representation of ternary S192A MDD co-crystal structure (green). Area of active site ‘funnel’ (∼300 Å2) measured from Ala101 Cβ to Lys68 NZ (19.3 Å) and Lys188 NZ to Leu60 CD2 (15.7 Å), side chains colored purple. (D) Surface representation of ternary D283A MDD co-crystal structure (red). Area of active site ‘funnel (∼99 Å2) measured from Ala101 Cβ to Lys68 NZ (10.5 Å) and Ser187 OG to Leu60 CD2 (9.4 Å), side chains colored cyan.