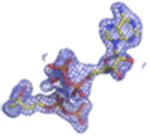
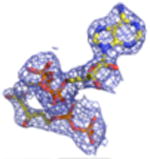
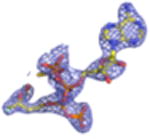
Table 1. Diffraction Data Collection and Structure Refinement Statistics3.
| Diffraction Dataa | ||||||||
| Protein | S192A MDD | S192A MDD | S192A MDD | MDD | D283A MDD | MDD | D283A MDD | |
| Ligands | DPGP | FMVAPP | FMVAPP | MevPP | MevPP | DPGP | ||
| ATPγS | ATPγS | ATPγS | ||||||
| Beamline | APS 22-ID | APS 22-ID | APS 22-ID | APS 22-ID | APS 22-ID | APS 22-BM | APS 22-BM | |
| Space Group | C2221 | C2221 | C2221 | C2 | P212121 | C2221 | C2221 | |
| Molecules in asu | 2 | 2 | 2 | 2 | 8 | 2 | 2 | |
| Unit-cell parameters | ||||||||
| a (Å) | 82.922 | 82.678 | 82.732 | 102.251 | 96.459 | 82.592 | 82.966 | |
| b (Å) | 102.273 | 101.733 | 103.14 | 82.46 | 99.445 | 101.32 | 102.05 | |
| c (Å) | 155.942 | 155.498 | 156.749 | 93.649 | 314.418 | 154.932 | 155.143 | |
| β (°) | 122.34 | |||||||
| Wavelength (Å) | 1.0000 | 1.0000 | 1.0000 | 1.0000 | 1.0000 | 1.0000 | 1.0000 | |
| Resolution (Å) | 50.0 - 1.95 | 50.0 - 2.15 | 50.0 - 1.90 | 50.0 - 2.19 | 50.0 - 2.60 | 50.0 - 2.20 | 50.0 - 2.10 | |
| Completeness (%) | 100.0 (100.0) | 91.7 (82.0) | 99.7 (99.6) | 99.9 (99.4) | 98.2 (99.9) | 99.8 (99.1) | 95.0 (88.1) | |
| Total Reflections | 355,071 | 195,781 | 539,192 | 183,389 | 699,223 | 306,240 | 232,548 | |
| Unique Reflections | 48,719 | 33,395 | 52,862 | 33,632 | 91,579 | 33,287 | 36,836 | |
| Redundancy | 7.3x | 5.9x | 10.2x | 5.5x | 7.6x | 9.2x | 6.3x | |
| Rmerge (%)b | 8.3 (38.2) | 7.6 (32.0) | 8.0 (58.4) | 7.5 (49.7) | 20.3 (59.2) | 11.7 (55.7) | 9.3 (53.8) | |
| <I>/<σI> | 19.3 (5.83) | 15.7 (5.29) | 20.5 (3.2) | 19.7 (3.31) | 7.57 (3.75) | 19.8 (3.04) | 19.3 (3.58) | |
| PDB | 4DPX | 4DPY | 4DPU | 4DPT | 4DPW | 4DU7 | 4DU8 | |
| Refinement | ||||||||
| Rwork/Rfreec | 16.24/20.01 | 16.75/22.62 | 17.91/22.37 | 18.62/24.07 | 19.87/25.08 | 19.15/23.88 | 18.63/23.87 | |
| RMSD | ||||||||
| Bond Length (Å) | 0.007 | 0.008 | 0.007 | 0.010 | 0.009 | 0.007 | 0.007 | |
| Bond Angle (°) | 1.005 | 1.017 | 1.058 | 1.192 | 1.121 | 0.971 | 1.001 | |
| Ramachandran | ||||||||
| Favored (%) | 98.6 | 98.0 | 98.5 | 96.5 | 97.7 | 98.6 | 98.0 | |
| Allowed (%) | 1.4 | 2.0 | 1.4 | 3.3 | 2.3 | 1.4 | 2.0 | |
| Outliers (%) | 0.0 | 0.0 | 0.2 | 0.2 | 0.0 | 0.0 | 0.0 | |
| Number of Atoms | ||||||||
| Protein | 5102 | 5102 | 5125 | 5017 | 20,386 | 5055 | 5074 | |
| Solven | ||||||||
| t | 587 | 399 | 488 | 256 | 266 | 275 | 293 | |
| Ligand | N/A | 40 | 100 | 50 | 392 | 36 | 40 | |
| B factor (ÅΛ2) | ||||||||
| Protein | 23.2 | 26.5 | 27.9 | 37.7 | 50.9 | 35.0 | 27.7 | |
| Solven | ||||||||
| t | 30.6 | 29.3 | 31.8 | 37.6 | 51.0 | 34.6 | 28.9 | |
| Ligand | N/A | 23.5 | 27.9 | 55.3 | 45.7 | 30.9 | 29.3 | |
| Density Galleryd | ||||||||

|

|

|

|

|

|
Numbers in parentheses are for the highest-resolution shell.
Rmerge = ΣhΣi|Ii(h)-<I(h)>|/ΣhΣiIi(h), where Ii(h) is the ith measurement of reflection h and <I(h)> is a weighted mean of all measurements of h.
R = Σh|Fobs(h)-Fcalc(h)|/ Σh|Fobs|. Rcryst and Rfree were calculated from the working and test reflection sets, respectively. The test set constituted 5% of the total reflections not used in refinement.
2Fo-Fc electron density maps (blue mesh contoured at 1.0σ) of modeled ligands.
