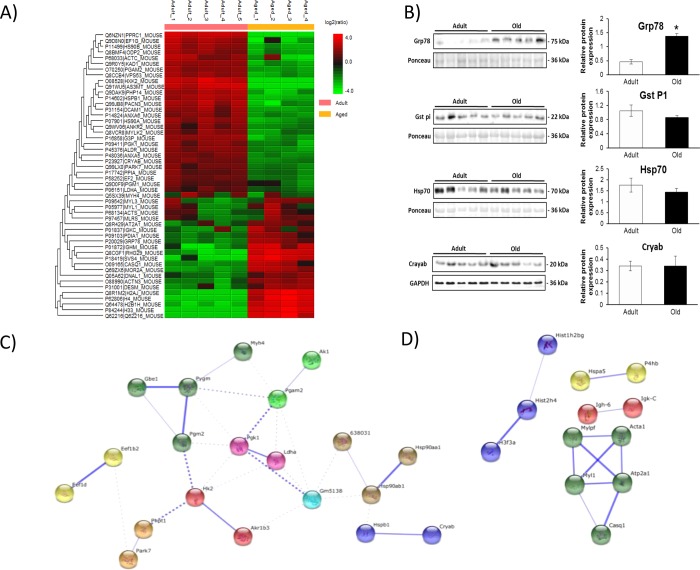
Figure 3.
(A) Heatmap of significantly up- and downregulated proteins in gastrocnemius mouse tissue from adult and old mice detected by PEAKS label-free quantification software (p < 0.01, min fold change >1.5, quality 0.8, and at least one unique peptide). (B) Western blotting for Grp78, Gst P1, Hsp70, and Cryab. (C) String-DB analysis of up- and downregulated proteins in samples from adult vs old mice. Upregulated proteins in samples from adult mice are enriched for carbohydrate catabolic processes as analyzed by String-DB analysis (p = 2.12 × 10⁻⁶). (D) Upregulated proteins in samples from old mice are enriched for skeletal muscle contraction proteins (p = 8.44 × 10⁻²). Stronger associations are represented by thicker lines.

