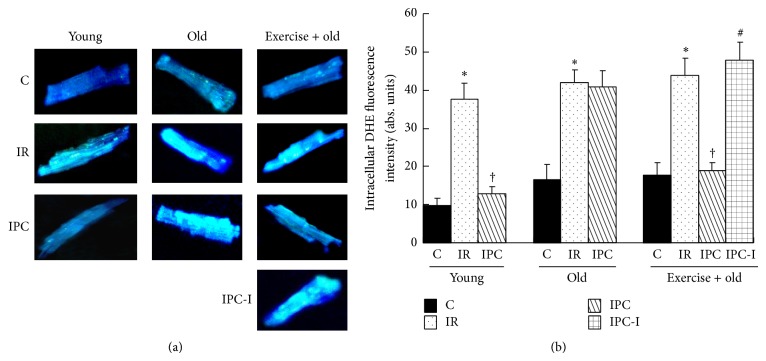
Figure 6.
(a) Isolated cardiomyocytes were preloaded with DCFH-DA to measure ROS generation. (b) Statistical analysis of the average fluorescence intensity from the cardiomyocytes. The data shown are the mean ± SE (n = 6 per group). * P < 0.05 versus the control group; † P < 0.05 versus the IR group; # P < 0.05 versus exercised old PC group.

