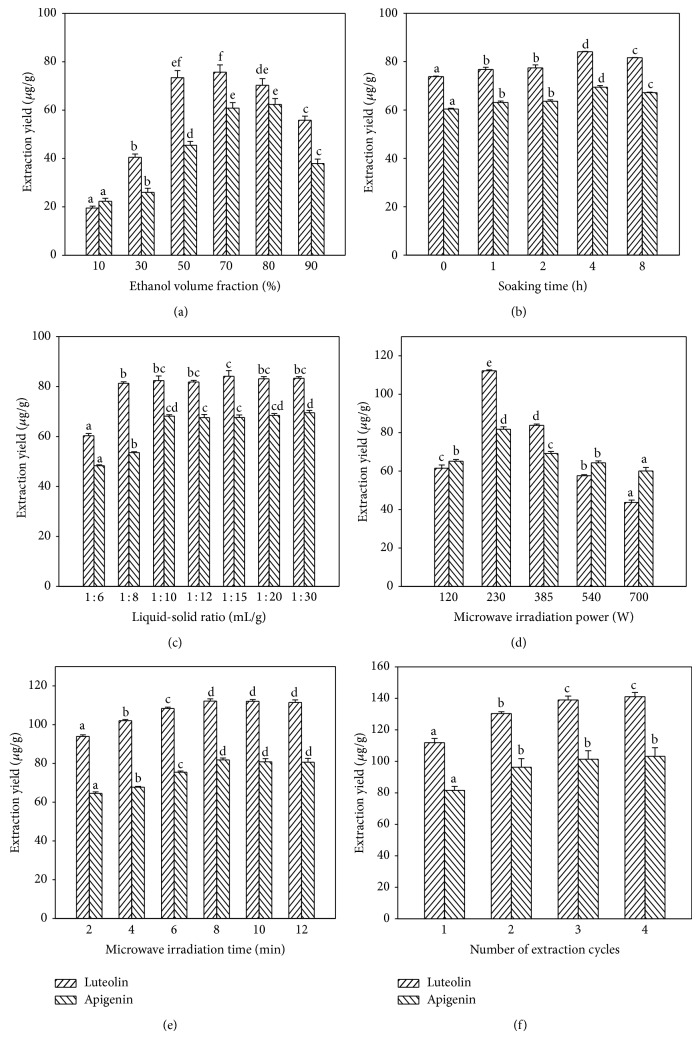
Figure 2.
The influence conditions ((a): ethanol volume fraction; (b): soaking time; (c): liquid-solid ratio; (d): microwave irradiation power; (e): microwave irradiation time; (f): number of extraction cycles) on the extraction yields of luteolin and apigenin. The values represent means ± standard deviation. Values followed by the same letter in the same assay are not significantly different (P > 0.05, n = 3).

