Figure 2.

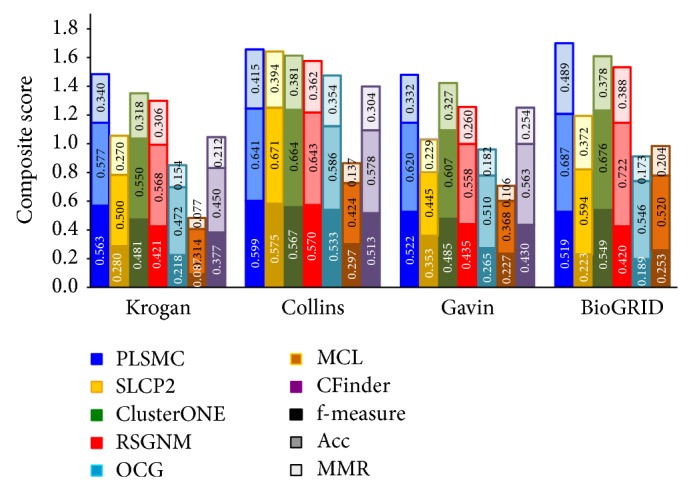
Comparison on composite score of the algorithms applied to four networks. Various shades of the same color denote f-measure, Acc, and MMR submetrics. The total height of each bar is the value of composite score.

Comparison on composite score of the algorithms applied to four networks. Various shades of the same color denote f-measure, Acc, and MMR submetrics. The total height of each bar is the value of composite score.