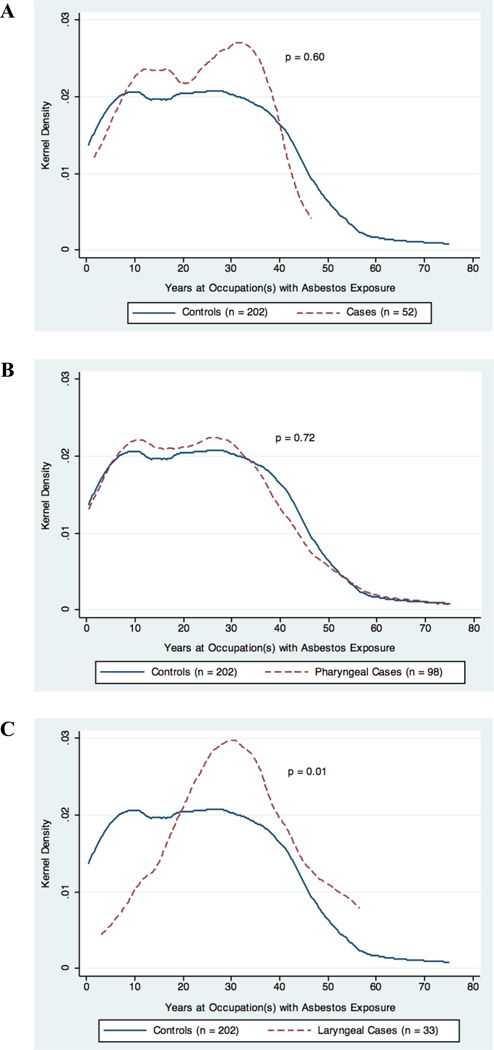
Figure 1.
Distribution of duration at an occupation(s) with asbestos exposure in years by case-control status among study subjects reporting ever having been exposed. The plots represent the kernel density of duration of exposure for controls and A) oral cavity carcinoma cases, B) pharyngeal carcinoma cases, C) and laryngeal carcinoma cases. The p-value for difference between cases and controls was determined by Wilcoxon rank sum test and is presented on each respective corresponding plot.

