
Figure 2.
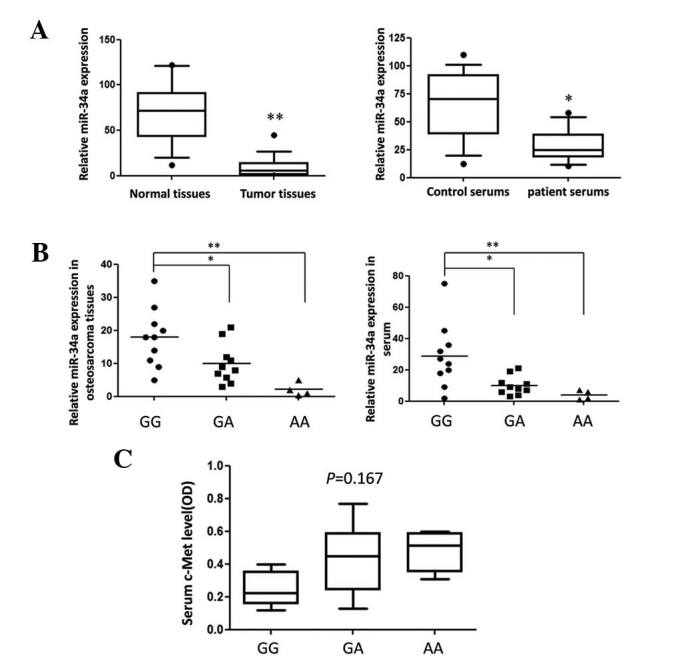
Relative miR-34a expression in OS tissues. The expression levels of miR-34a-5p in (A) 60 random individual samples and (B) 24 genotyped samples of OS tissue were detected using quantitative polymerase chain reaction. Statistical analyses were performed to evaluate the overall trend of miR-34a in all OS tissues and adjacent normal bone tissues. miR levels were normalized against U6 small nuclear RNA. The Y-axis displays the relative ratio of miR-34a normalized to U6. *P<0.05, **P<0.01. (C) The serum c-Met concentration in different genotypes of OS patients was measured using ELISA. The results were analyzed by the Mann-Whitney U test. P<0.05 was considered statistically significant. Results are expressed as the mean±standard deviation. miR, micro RNA; OS, osteosarcoma.