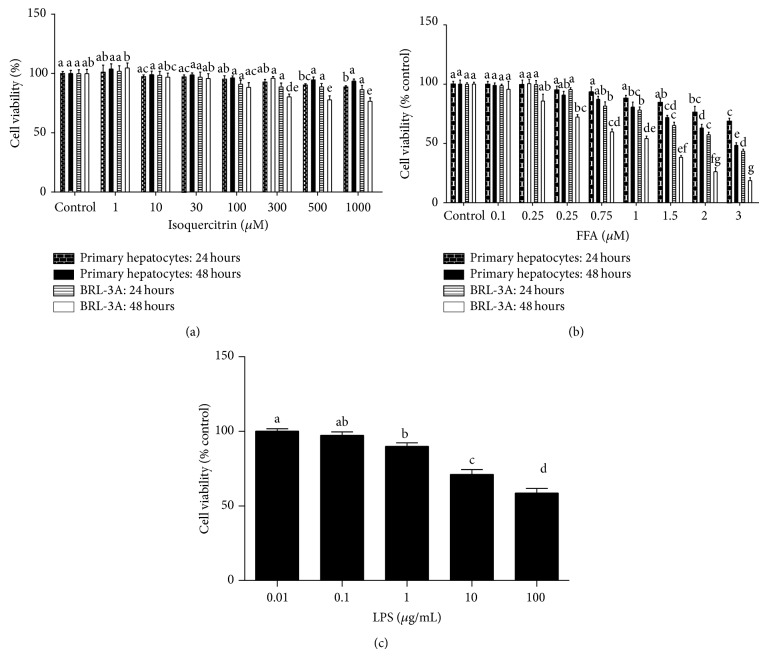
Figure 2.
Cell viability assay on BRL-3A cells and primary rat hepatocytes. Cells were cultured in 96-well plates and treated with different doses of isoquercitrin (a) and FFA (b) for 24 hours and 48 hours. (c) Primary hepatocytes were cultured in 96-well plates and treated with various LPS doses for 12 hours. After the required period of time cells were administered with MTT for 3 hours before dissolving it with organic solvent. The data represents ±SD. P < 0.05 was considered as statistically significant. Different superscripts letters demonstrate the significant statistical difference as calculated by ANOVA followed by Tukey's test.

