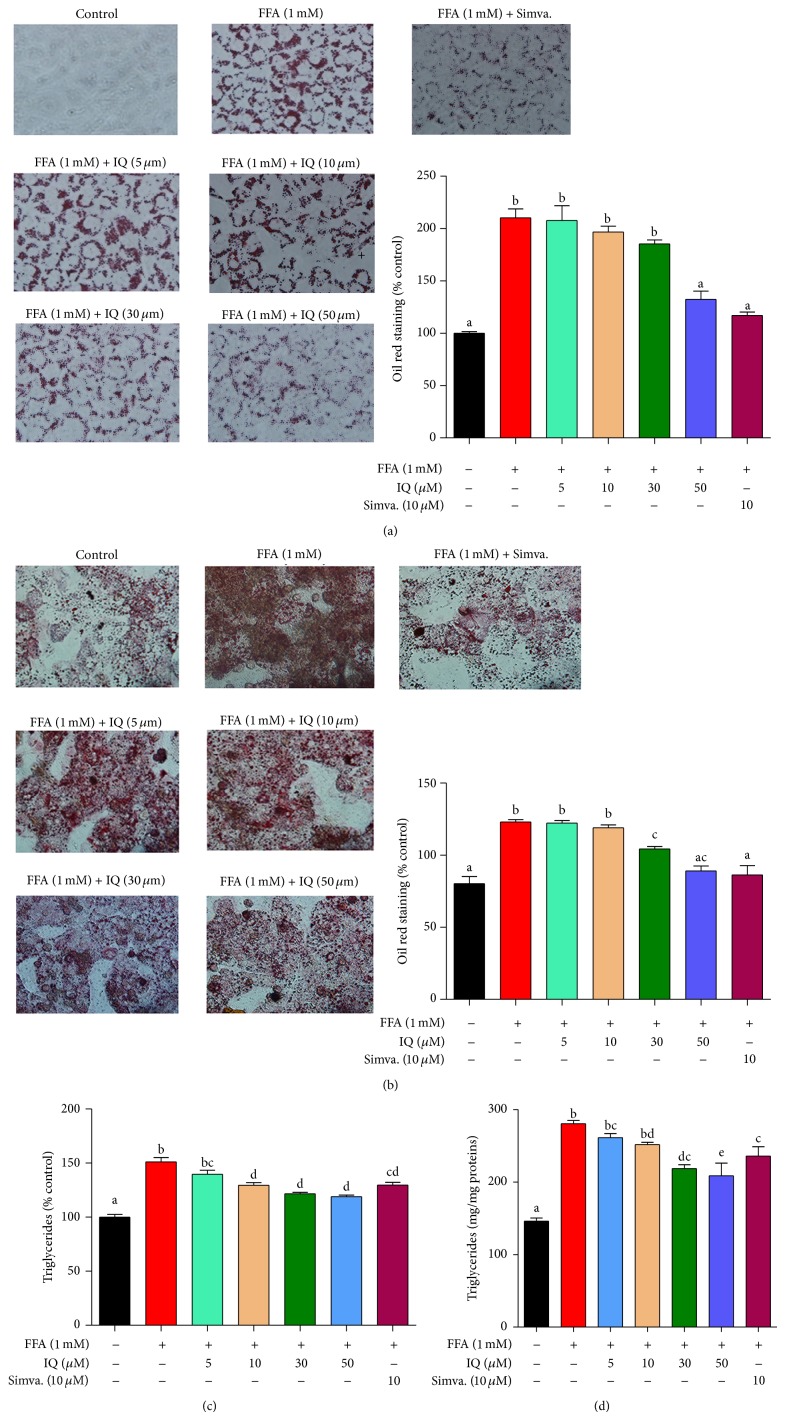
Figure 3.
Illustrates the effects of isoquercitrin at different doses on hepatic lipid accumulation and intracellular triglycerides (TG). BRL-3A cells ((a) and (c)) and primary rat hepatocytes ((b) and (d)) were treated with 1 mM FFA and/or isoquercitrin for 24 hours. After the treatment duration cells were washed, fixed, and stained with oil red o dye. The images of cells were captured by microscope at ×400 of original magnification. Intracellular TG was measured by commercially available kits. Proteins were calculated by BCA method. Values for primary rat hepatocytes were expressed in mg/mg proteins, while values for BRL-3A cells were indicated in % control. The data represents ±SD. P < 0.05 was considered as statistically significant. Different superscripts letters demonstrate the significant statistical difference as calculated by ANOVA followed by Tukey's test.

