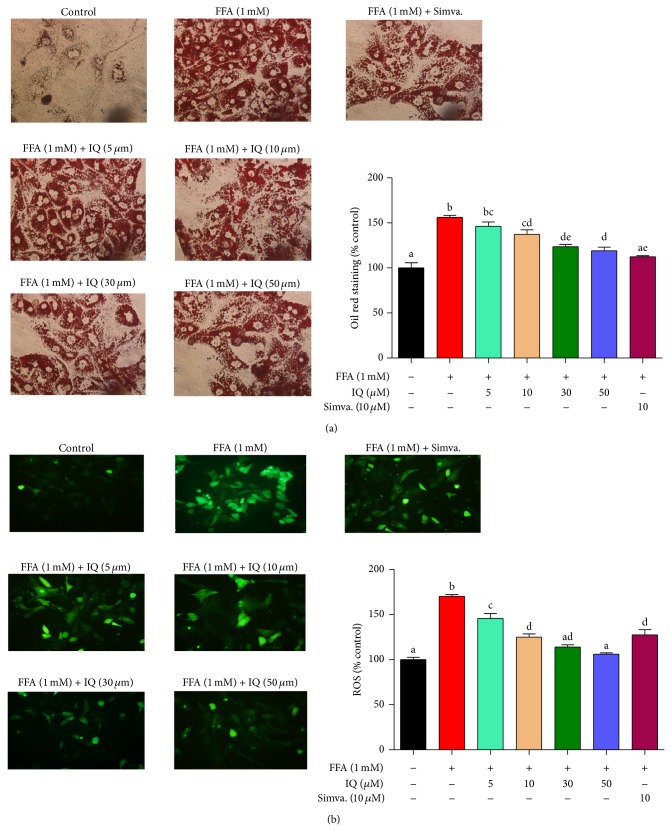
Figure 6.
Effects of IQ on intracellular lipid accumulation and ROS levels. Primary rat hepatocytes were treated with FFA for 24 hours first and then treated with IQ for another 24 hours. Lipid accumulation was determined by oil red staining while ROS was analyzed with H2DCF-DA by the method described in material and methods. (a) shows the effects IQ on lipid accumulation; (b) displays the effects of IQ on ROS. The data represents ±SD. P < 0.05 was considered as statistically significant. Different superscripts letters demonstrate the significant statistical difference as calculated by ANOVA followed by Tukey's test.

