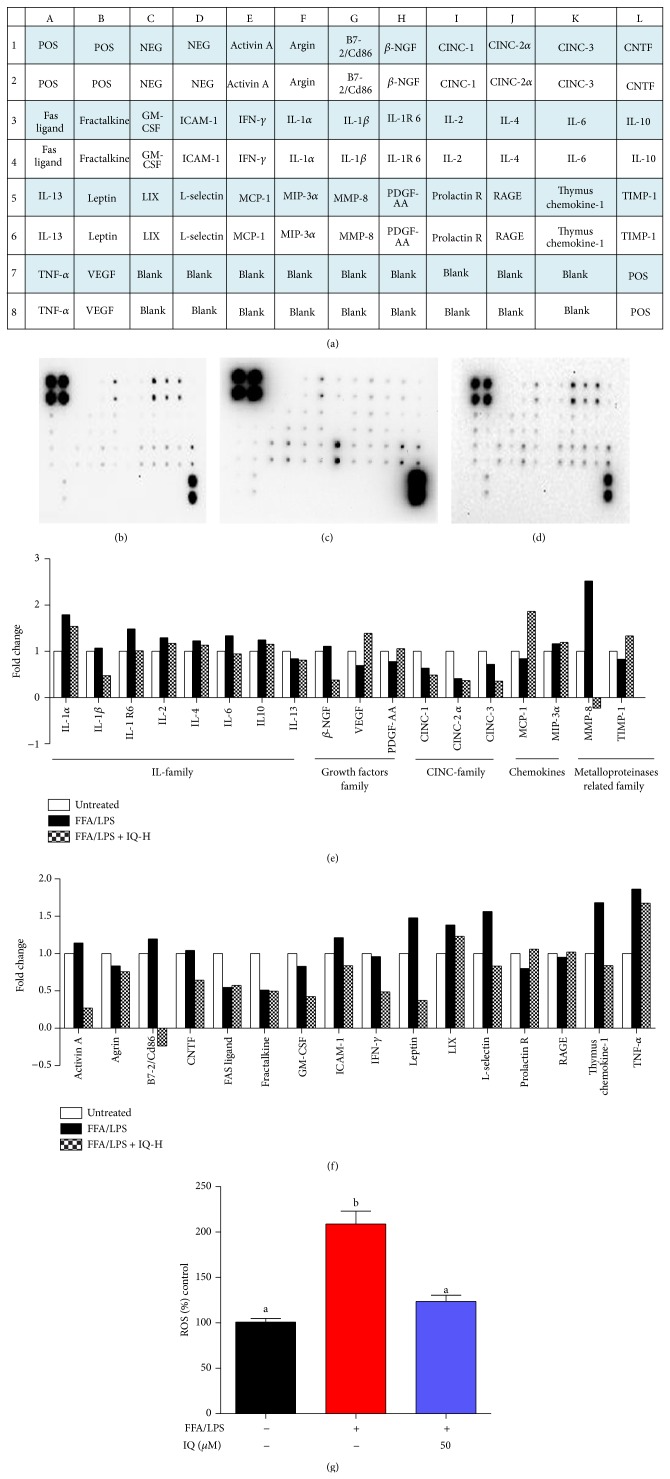
Figure 8.
Activities of IQ on cytokines profile. Primary rat hepatocytes were cocultured with Kupffer cells and induced with FFA/LPS or left untreated for 24 hours. Cells were cotreated with IQ-H (50 μM) for 24 hours. Afterwards, supernatants were collected and subjected to cytokine antibody array. (a) shows the array map. Each cytokine is represented as twin blots on array map. (b) untreated membrane; (c) FFA/LPS induced membrane; (d) IQ-H cotreated membrane. (e) illustrates the graphical representation of IL family cytokine, CINC family, growth factors, macrophage related cytokines, and MMP related cytokines. (f) analyses the changes in various other potentially important cytokines. Array blots are expressed as fold change. Average net optical intensities from each group for single cytokine were used to measure fold changes using ND group as reference. (g) measured the ROS in above-described coculture model. The data represents ±SD. P < 0.05 was considered as statistically significant. Different superscripts letters demonstrate the significant statistical difference as calculated by ANOVA followed by Tukey's test. POS, positive; NEG, negative; beta-NGF, nerve growth beta; CINC, cytokine-induced neutrophil chemoattractant; CNTF, ciliary neurotrophic factor; GM-CSF, granulocyte macrophage colony-stimulating factor; ICAM, intercellular adhesion molecule; IFN-gamma, interferon gamma; IL, interleukin; IL-1 R6, interleukin-1 receptor 6; LIX, C-X-C motif chemokine 5; MCP-1, monocyte chemoattractant protein-1; MIP-3, macrophage inflammatory protein-3; MMP-8, matrix metalloproteinase; PDGF-AA, platelet derived growth factor-AA; prolactin R, prolactin receptor; RAGE, advanced glycosylation end product receptor; TIMP-1, tissue inhibitor of metalloproteinases-1; TNF-alpha, tumour necrosis factor-alpha; VEGF, vascular endothelial growth factor.

