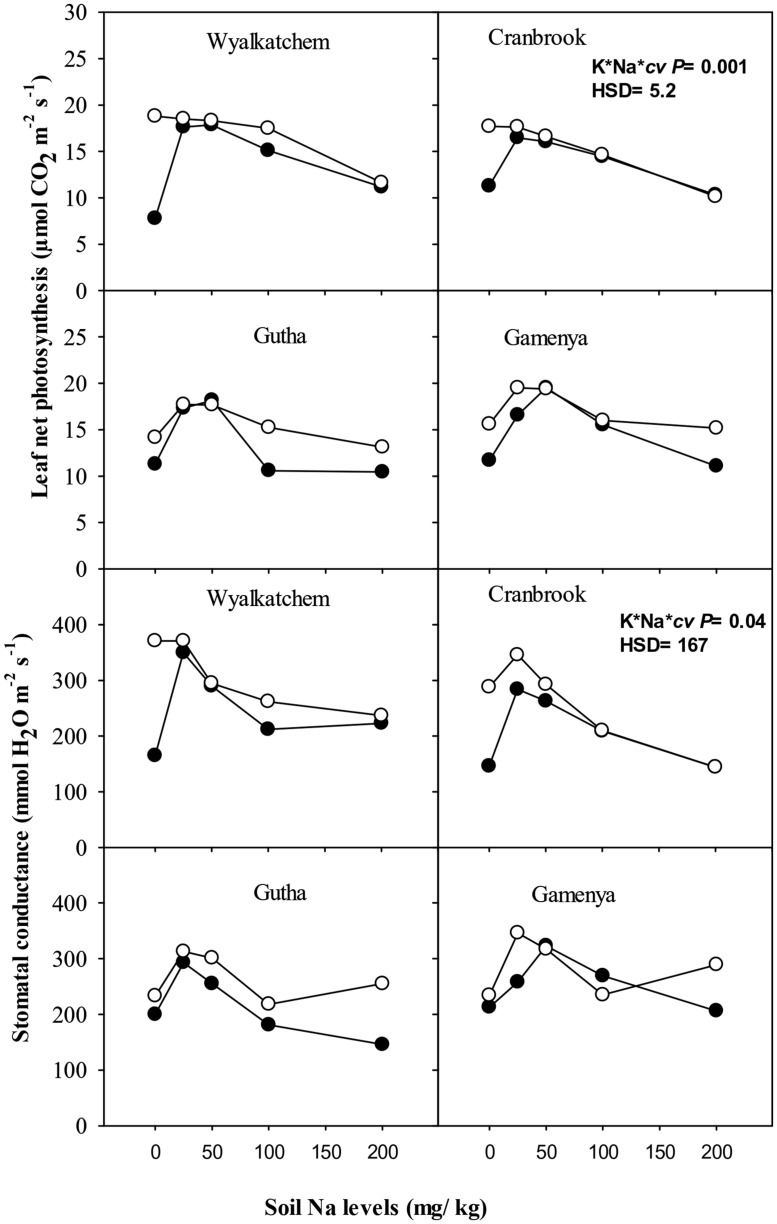
FIGURE 3.
Leaf photosynthesis (upper sub-figures) and stomatal conductance (upper sub-figures; n = 3) of four wheat cultivars, treated with 40 mg K/kg (closed circle) and 100 mg K/kg (open circle), and five soil Na levels (0, 25, 50, 100, and 200 mg Na/kg) for 8 weeks. See Table 1 for analysis of variance results.

