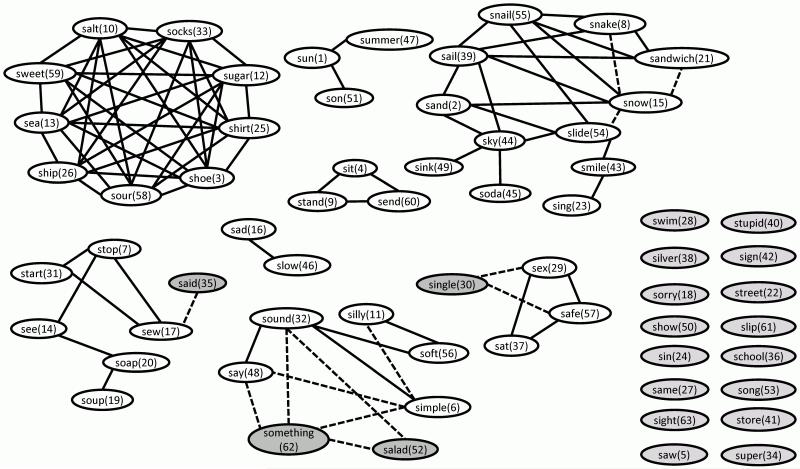
Figure 3.
S-word clusters identified via GTOM with 1.0 and 0.9 thresholds. As in Figure 2, solid connecting lines indicate that the GTOM threshold value between two words connected is 1.0. Broken lines indicate additional connections between words when the threshold is lowered to 0.9. Numbers within parentheses are the frequency rank of the word (1 through 63).

