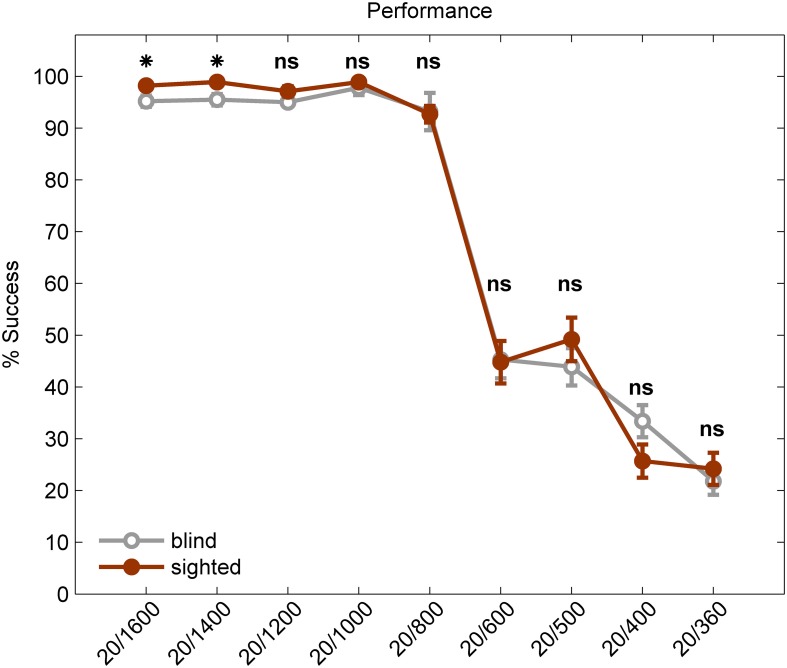
Figure 3.
Visual Acuity of the blind vs. the sighted participants using a visual-to-auditory SSD. Performance of blind participants (gray line) and sighted participants (red line) on the Snellen E test. An asterisk marks a significant difference between the two groups (p < 0.05; ns, not significant). The error bars represent standard error.

