
Figure 2.
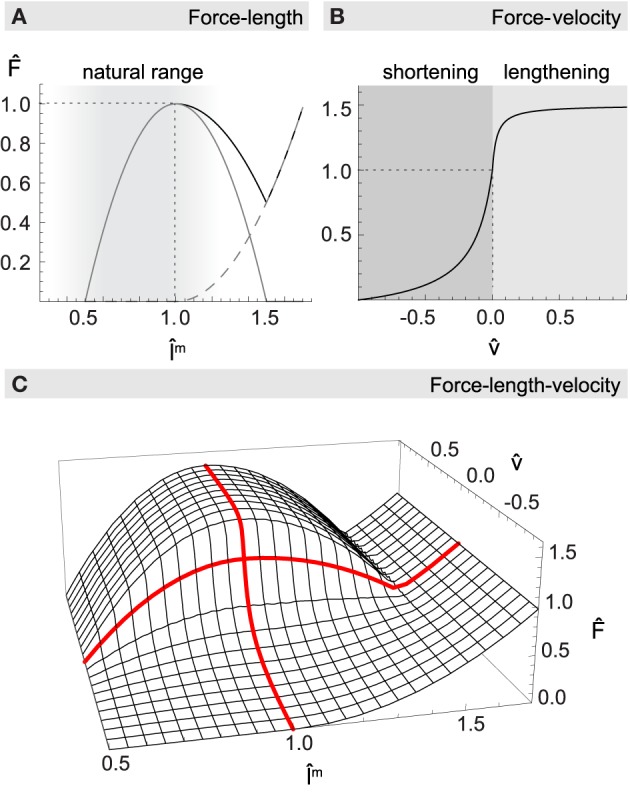
Normalized muscle force as a function of length m and velocity . (A) The net force-length relationship (black solid line) is formed additively by a passive elasticity resisting lengthening of the muscle (dashed gray line), and a hyperbolic function with maximum at resting length describing the active generation of force (gray solid line). Most muscles of the human upper arm are constrained to the ascending leg of the curve, as indicated by the shaded region. (B) The force-velocity relationship describes how force production drops with increasing shortening velocity and increases when actively lengthening. (C) Multiplicative combination of muscle length and velocity relationships for maximum activation level a = 1. Thick red lines highlight the force-length curve at rest ( = 0), and the force-velocity curve when the muscle is at its optimal length (m = 1).