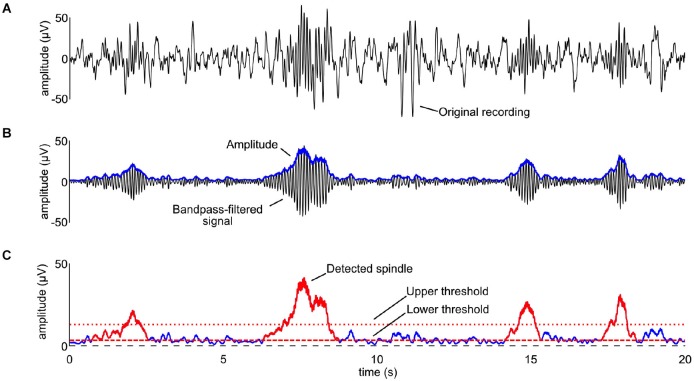
Figure 4.
The spindle detection procedure described in detail. (A) The original recording for one participant in stage S2. (B) The signal was bandpass-filtered between 9 and 15 Hz (black line) and the time-course of its amplitude was computed by rectifying the signal, applying a low-pass filter at 4 Hz (Nir et al., 2007), and multiplying by √2 (blue line). (C) An upper threshold equal to the 4.5 times the mean of the amplitude in stages S2, S3, and S4 was used for the detection of the spindles (dotted red line). A lower threshold was used to define the beginning and end of each spindle (dotted dashed line). Detected spindles are shown as red traces superimposed on the time-course of the amplitude. Note that the x-axis is the same for all the panels, while the y-axis in the bottom panel is twice as large as that of panels (A) and (B).

