Figure 4.
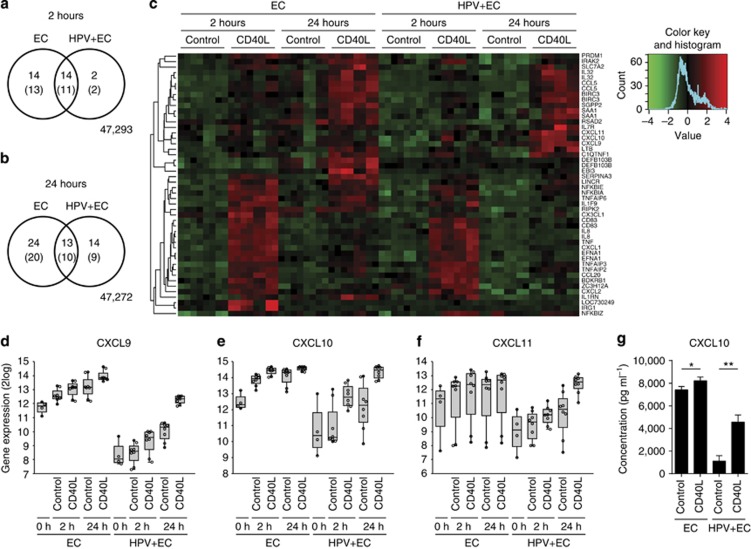
HPV infection results in an attenuated response of epithelial cell (ECs) to CD40 ligation. Venn diagrams showing the overlapping genes between ECs and human papilloma virus (HPV)-positive ECs in their response to L-CD40L versus L-control stimulation for 2 (a) and 24 (b) hours; significance thresholds as in Figure 2a, numbers in brackets represent unique genes. (c) Heat map of differentially expressed immune-involved genes as determined by Ingenuity Pathway Analysis. Expression ratios for each condition compared with the 0 hour time point per cell line were mean-centered and scaled over all conditions. The genes were hierarchically clustered using cosine similarity and average linking. Microarray intensities for CXCL9 (d), 10 (e), and 11 (f) represented in a box plot. (g) CXCL10 concentration as measured by ELISA in supernatants of 24 hours IFNγ-stimulated and L-control or L-CD40L cocultured foreskin ECs and HPV-positive foreskin ECs (n=3). * Indicates P<0.05 and ** P<0.005.

