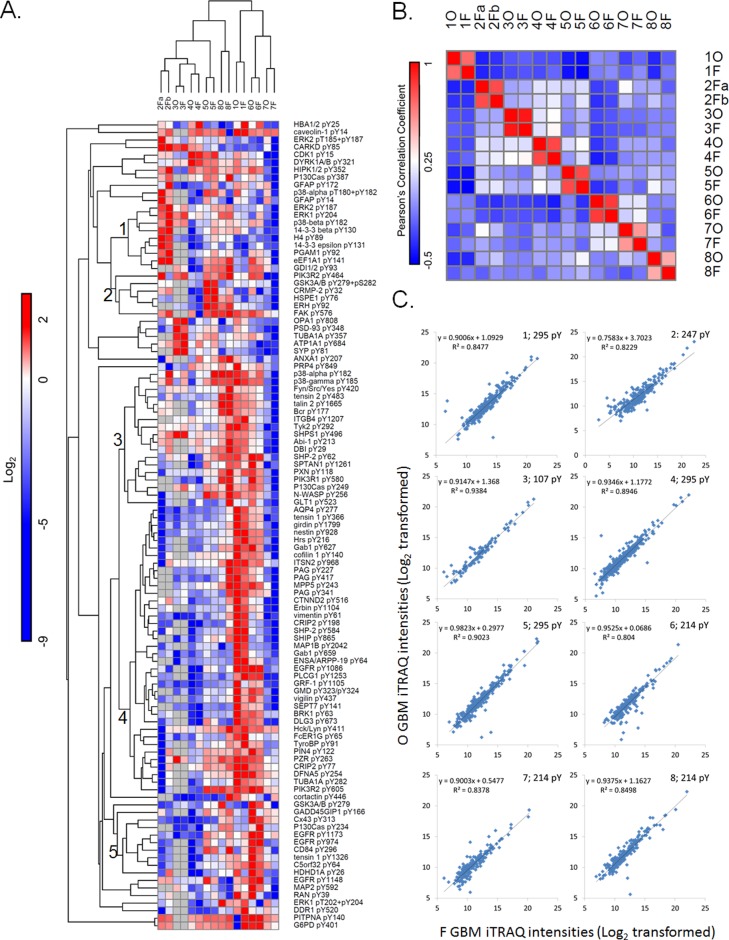
Figure 2.
Phosphotyrosine signaling is distinctly different across different GBM patients but similar between OCT and flash frozen processed tumors. (A) The 107 overlapping phosphotyrosine sites quantified across at least 14 OCT compound embedded and flash frozen GBM tumor sections are visualized in the heat map. iTRAQ ratios were normalized to tumor section 5F, normalized to the mean, and log2 transformed. Tumor sections and tyrosine phosphorylation sites were hierarchically clustered using one minus Pearson’s correlation distance metric. Missing values in tumors 2Fa, 2Fb, 3O, and 3F are shaded gray. (B) A correlation matrix of all 16 tumors sections based on the quantitative phosphotyrosine data. The Pearson’s coefficients between every pair of tumor sections are displayed in each box. The color bar indicates the correlation coefficients, where red indicates positive correlation and blue indicates negative correlation. (C) Log2-transformed iTRAQ intensities from the OCT (O) compound embedded tumor sections (y axis) were plotted against the corresponding flash frozen (F) tumor sections (x axis). A simple linear regression line was drawn through the data points and the R2 values were determined for all eight GBM tumor pairs.

