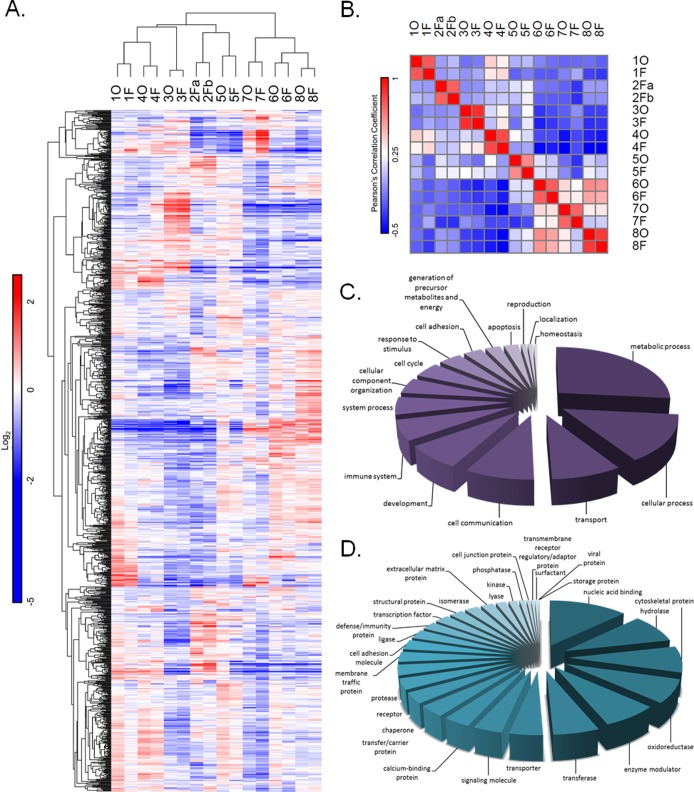
Figure 3.
Protein expression profiling highlights significantly different expression patterns across GBM patients but a high degree of similarity between OCT and flash frozen processed tumors. (A) The 1037 overlapping protein groups quantified across all 16 OCT compound embedded and flash frozen GBM tumor sections are visualized in the heat map. iTRAQ ratios were normalized to tumor section 5F, normalized to the mean and log2 transformed. Tumor sections and protein groups were hierarchically clustered using one minus Pearson’s correlation distance metric. (B) A correlation matrix of all 16 tumors sections based on the quantitative protein expression data. The Pearson’s coefficients between every pair of tumor sections are displayed in each box. The color bar indicates the correlation coefficients, where red indicates positive correlation and blue indicates negative correlation. (C) A pie chart diagram displaying the PANTHER GO biological processes annotation analyses carried out for the 1037 overlapping protein groups. (D) A pie chart diagram displaying the PANTHER GO protein classes’ annotation analyses carried out for the 1037 overlapping protein groups.

