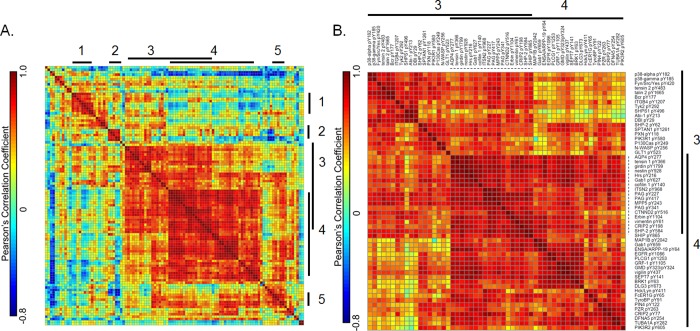
Figure 4.
Correlation analyses across the 107 overlapping phosphotyrosine sites reveal clusters of phosphorylation sites with similar quantitative profiles across the 16 tumor sections. (A) Phosphotyrosine peptides were hierarchically clustered using one minus Pearson’s correlation distance metric prior to correlation analysis. The cluster numbers are indicated on the top and right-hand side of the correlation matrix. (B) Zoomed in correlation matrix showing cluster 3 and 4, which includes 56 phosphotyrosine sites. Protein and phosphotyrosine site is labeled at the top and right-hand side of the correlation matrix. The color bars in (A) and (B) indicate the correlation coefficients, where red indicates positive correlation and blue indicates negative correlation. The 18 phosphotyrosine sites that are overlapping cluster 3 and 4 are highlighted by a dashed line.

