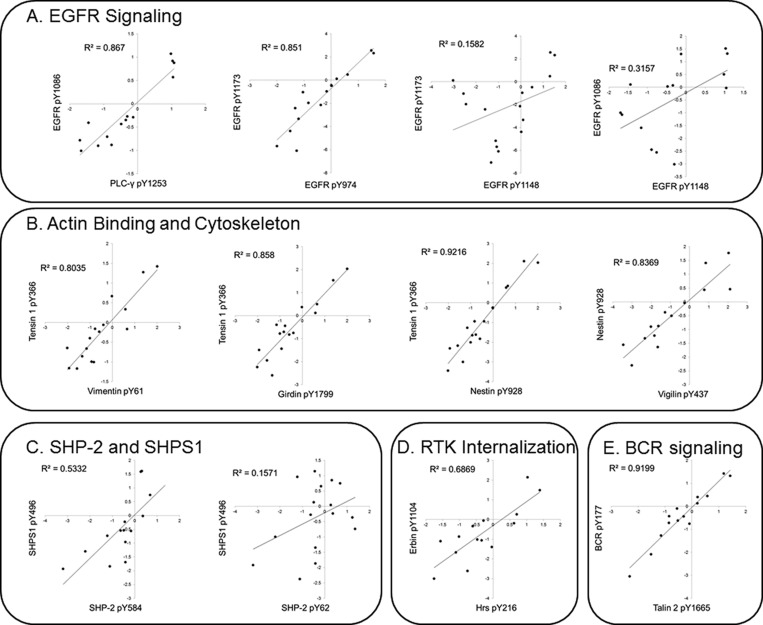
Figure 5.
Phosphotyrosine sites that cluster together are functionally related. Log2 transformed iTRAQ ratios for all 16 tumor sections are plotted in the graphs, and the associated phosphotyrosine site is labeled on the y and x axis. R2 values associated with pairwise correlation analyses are displayed in the top left-hand corner of each graph. (A) Graphs showing correlations between EGFR autophosphorylation sites. (B) Graphs showing the correlations between phosphorylation sites involved in actin binding and cytoskeleton. (C) Correlation between SHP-2 and the associated SHP-2 docking protein SHPS1. (D) Graphs showing the correlations between RTK internalization phosphorylation sites on Erbin and Hrs are plotted.

