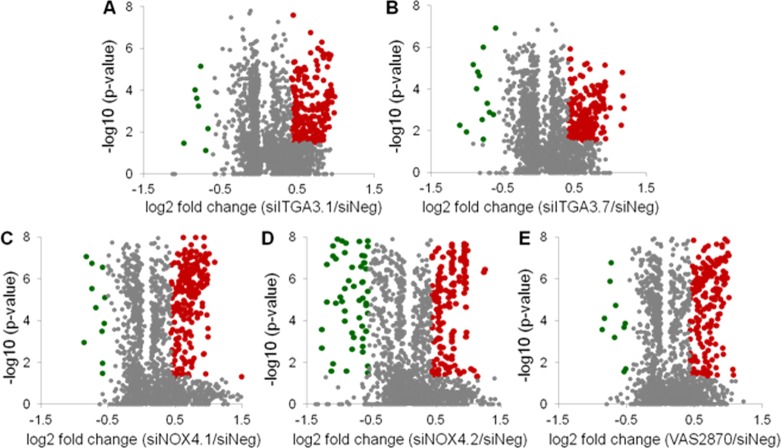
Figure 2.
Volcano plots displaying the statistical p-value test with the magnitude of the abundance change to identify protein expression changes that are statistically significant. (A, B) Proteins changed in expression with ITGA3 silencing. (C–E) Protein altered in expression with NOX4 gene silencing or chemical inhibition. Green data points represent downregulated proteins, and red data points represent upregulated proteins.

