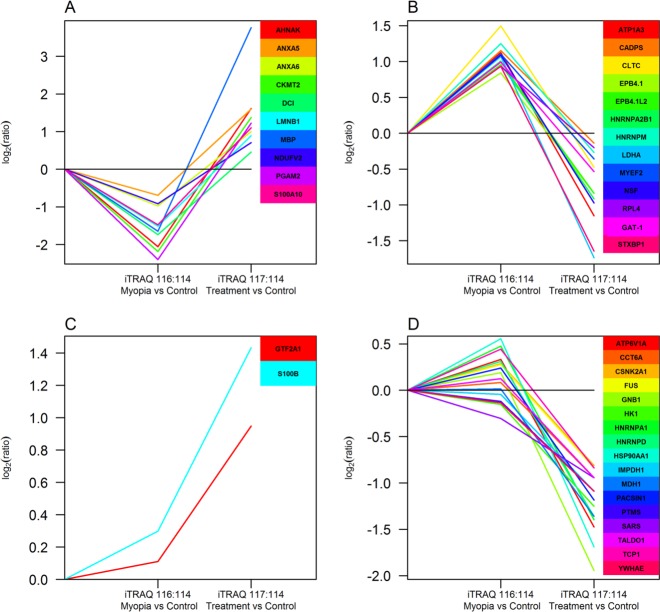
Figure 5.
Clustering analysis on up-regulated or down-regulated proteins common to four sets of data showing the similar trend of the expression profile in control, myopia, and atropine treatment using the Short Time-series Expression Miner (STEM) software. (A) Down-regulated in myopia and increased after atropine treatment. (B) Up-regulated in myopia and decreased after atropine treatment. (C) No change in myopia and increased after atropine treatment. (D) No change in myopia and decreased after atropine treatment.

