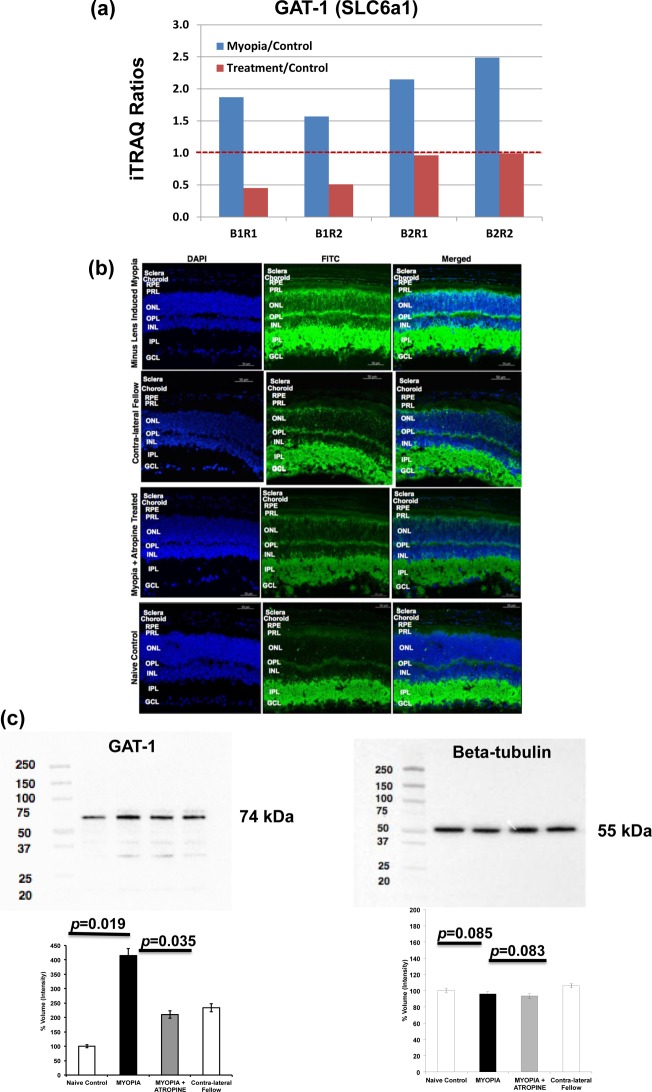
Figure 6.
(a) iTRAQ results of GAT-1 level in myopic group and atropine-treated group as compared with control group. (B1R1 and B1R2 represent Batch1, run1 and Batch 1, run2; B2R1 and B2R2 represent Batch2, run1 and Batch 2, run2). Blue bar: Myopia versus control; Red bar: Atropine-treated versus control. (b) Immunofluorescence labeling of GAT-1 in mouse retina, RPE, choroid, and sclera in naïve control and contralateral fellow eyes (exposure time for FITC/DAPI: 800/40Ms), induced myopic eyes (exposure time for FITC/DAPI: 800/60Ms), and atropine-treated eyes (exposure time for FITC/DAPI: 800/110Ms). The fluorescence intensity labeled of the green color shows the localization of proteins, and blue color indicates the nuclei that were stained with DAPI. Lower levels of GAT-1 abundance were seen in atropine-treated retina, RPE, choroid, and sclera similar to naïve control and contralateral fellow, whereas higher levels were observed in myopic retina, RPE, choroid, and sclera. The following abbreviations represent the retinal layers: NFL, nerve fiber layer; GCL, ganglion cell layer; IPL, inner plexiform layer; INL, inner nuclear layer; OPL, outer plexiform layer; ONL, outer nuclear layer; PRL, photoreceptor layer; and RPE, retinal pigment epithelium. n = 3 eyes per group and repeated in triplicate. (c) Retinal levels of GABA transporter-1 (GAT-1) in lens-induced myopic, contralateral fellow, atropine treated, and naïve control eyes. Beta-tubulin was used as a loading control. Western blot analysis of GAT-1 proteins in lens-induced myopic, atropine-treated, and naïve control eyes showed a pattern of protein expression similar to that of proteomics analysis. Data represent the mean ± SD; Significance level p ≤ 0.05.

