
Figure 2.
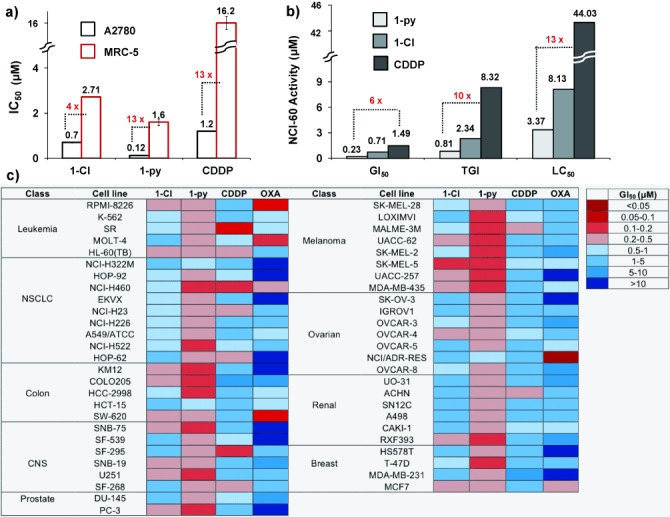
Antiproliferative activity. a) IC50 in A2780 cancer cells and MRC-5 normal lung fibroblasts of 1-py, 1-Cl,6c and CDDP. b) GI50, TGI, and LC50 values (μm) of 1-Cl,7 1-py, and CDDP in the NCI-60 screen. c) Heat map for GI50 values of 1-Cl, 1-py, CDDP, and oxaliplatin (OXA). The deep red color corresponds to the highest activity, whereas the deep blue color represents the lowest activity.