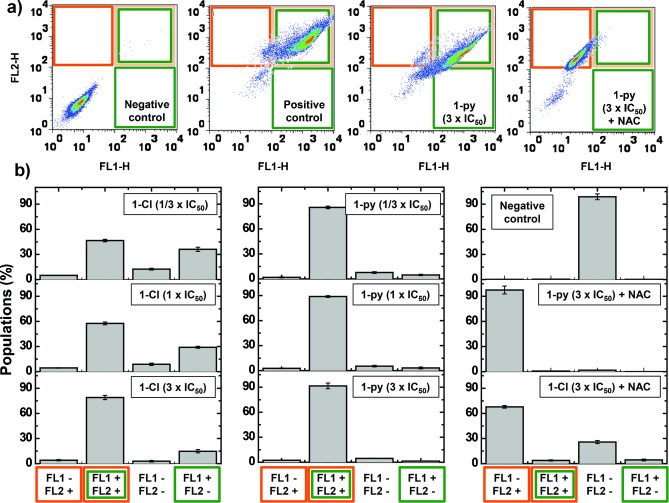
Figure 3.

Induction of ROS in A2780 human ovarian cancer cells. a) Comparison of flow cytometry dot plots: Untreated cells (negative control), cells treated with ROS-inducer pyocyanin (1 μm, positive control), cells treated with three times the amount of the IC50 value of 1-py, and cells treated with three times the amount of the IC50 value of 1-py and NAC (5 μm). The green channel (FL1) detects total oxidative stress, and the orange channel (FL2) detects superoxide production. b) Comparison of the populations exposed to different concentrations (1/3 IC50, IC50, and 3× IC50) of 1-Cl or 1-py and populations exposed to the highest concentration of each iridium complex and NAC. In all cases, the cells were exposed to the drug for one hour at 310 K.
