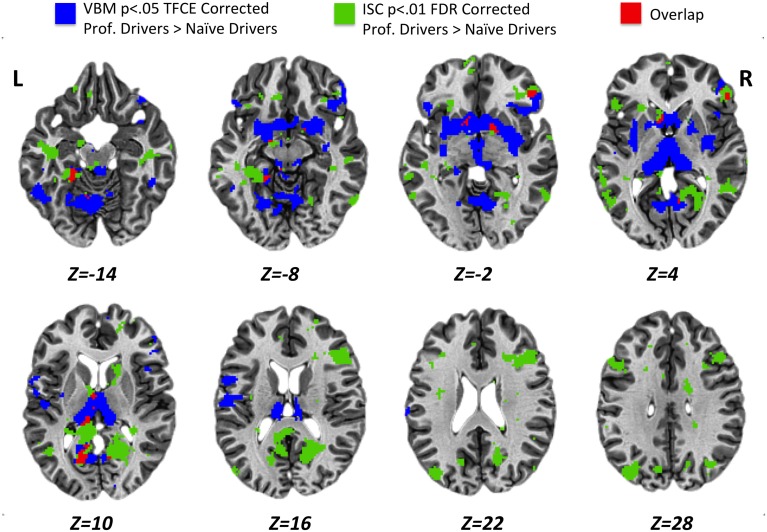
Figure 4.
Results obtained for VBM (p < 0.05 TFCE corrected) and ISC (p < 0.01 FDR corrected) analyses from the comparison between professional race car drivers and naïve subjects. Blue voxels represent brain areas with a significantly higher gray matter density, while green voxels refer to regions that were significantly more activated in expert drivers, as compared to the naïve subjects, during the passive driving task. In red, overlap regions between VBM and ISC results.

