Figure 3.
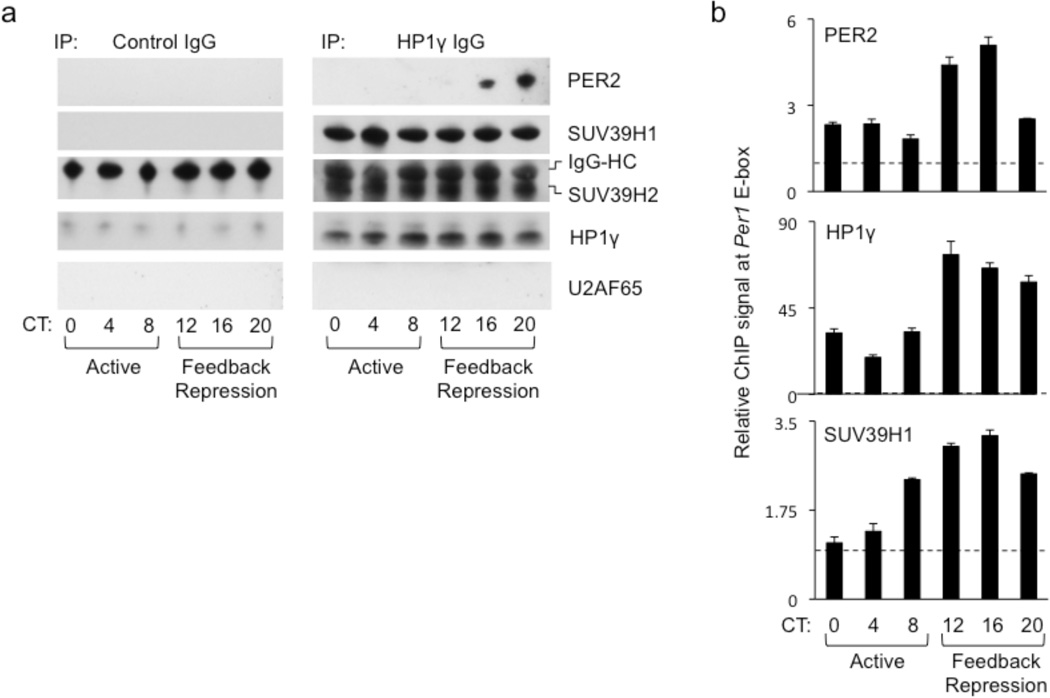
Coordinate circadian rhythm of PER2 and HP1γ-SUV39H at the Per1 promoter. (a) Circadian profiles of co-immunoprecipitation of the proteins indicated at right with control IgG (left) or HP1γ IgG (right) from mouse liver nuclear extracts. U2AF65 served as negative control, IgG-HC (heavy chain) as positive control. Circadian times (CT) shown at bottom. (b) Circadian cycle of PER2, HP1γ, and SUV39H1 at Per1 proximal E-box site. ChIP assays from mouse livers sampled across a circadian cycle (bottom) performed with antibodies at the top left of each panel. ChIP values are normalized to the signal from a parallel IgG control ChIP (dashed line); data are displayed as mean +/− SEM of triplicate experiment and are representative of three independent experiments. Diagrams showing the sites of primers for ChIP assays of Per gene E-box sites can be found in Supplementary Figure 5b.

