Figure 4.
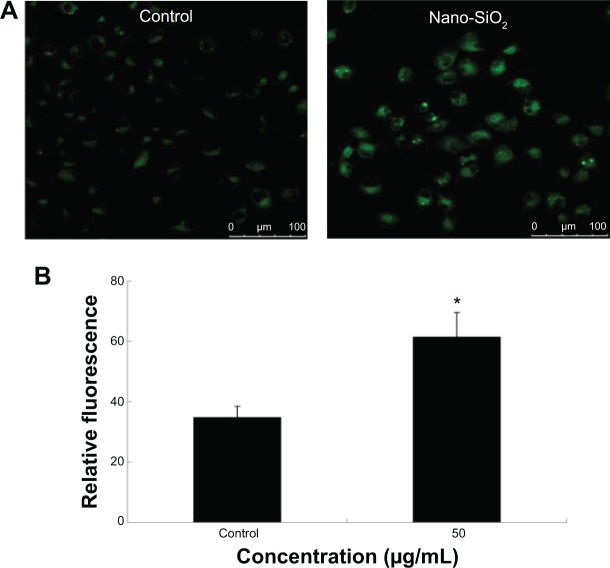
Detection of autophagic vacuoles induced by Nano-SiO2 via MDC staining.
Notes: (A) Confocal microscopy images of MDC staining after HUVECs were exposed to 50 μg/mL of Nano-SiO2 for 24 hours. (B) Quantification of MDC staining by fluorescent intensity analysis. Student’s t-test is used for the data analysis. Data are expressed as the mean ± standard deviation from three independent experiments (*P<0.05).
Abbreviations: Nano-SiO2, silica nanoparticles; MDC, monodansylcadaverine; HUVECs, human umbilical vein endothelial cells.

