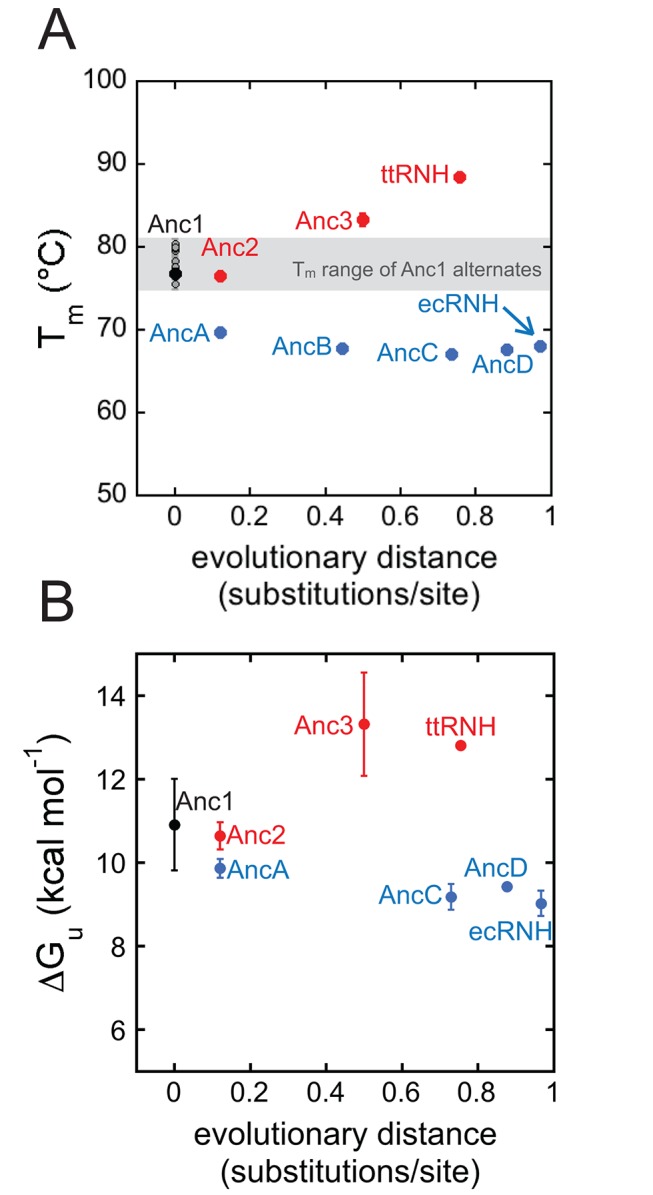
Figure 3. Thermophilic and mesophilic lineages exhibit opposite stability trends.

Starting with the shared ancestor, Anc1, stabilities increase along the thermophilic lineage and decrease along the mesophilic lineage. (A) Melting temperature of the maximum likelihood ancestors and the ten alternate reconstructions of Anc1 as a function of evolutionary distance from the last common ancestor, Anc1. Distances are calculated as the sum of the branch lengths connecting Anc1 to the protein of interest. The grey region defines the range of Tms measured for the Anc1 alternates, which appear individually as grey data points. The error bars are one standard deviation. (B) Average ΔGs at 25°C as a function of evolutionary distance from Anc1. Error bars are one standard deviation. See also Table S1 and Dataset S2.
