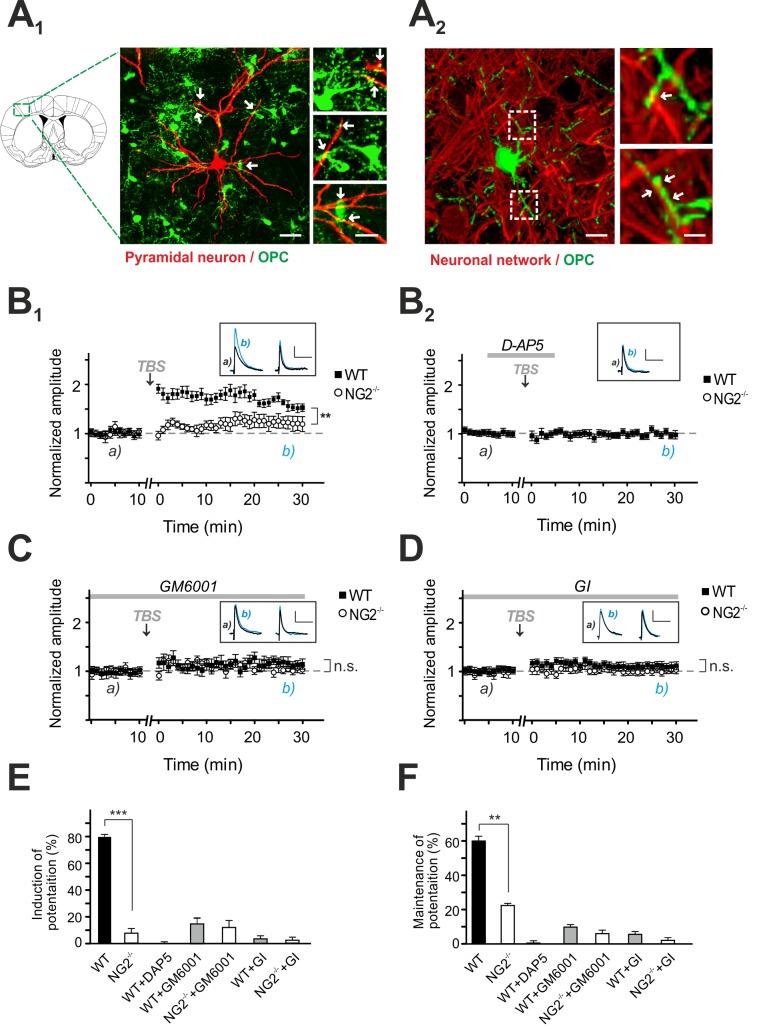
Figure 4. NMDAR-dependent LTP is impaired in NG2−/− mice and after inhibiting proteases in control slices.
(A) A1: Image of L2/3 pyramidal cell filled with biocytin (red) contacted by OPC expressing EYFP (green: NG2−/−-EYFP+/+ cells) as indicated by white arrows. Scale bars represent 25 µm and 10 µm in higher magnifications. A2: Image of a cortical OPC (green: NG2−/−-EYFP+/+ cells) and the surrounding neuronal network (red: SMI31, MAP-2, NeuN). Intimate contacts between both structures are highlighted. The image represents a 3D volume render of a confocal stack. Scale bars represent 10 µm and 2 µm in higher magnifications. (B1–B2) NMDAR-dependent LTP at L4-to-L2/3 synapses of pyramidal neurons in the somatosensory cortex of control mice (filled symbols) and NG2−/− mice (open symbols). The timepoint of LTP inducing TBS is indicated by black arrows. Small inserts show EPSPs at the indicated times (a and b). A block of NMDARs by D-AP5 application is indicated by the grey line (B2) (paired Student's t test). (C) NMDAR-dependent LTP in the presence of the metalloprotease inhibitor GM6001 (paired Student's t test). (D) NMDAR-dependent LTP in the presence of ADAM10 inhibitor GI (paired Student's t test). (E) Summary graph of NMDAR-dependent EPSPs after 1–5 min post-TBS (unpaired Student's t test). (F) Summary graph of the relative potentiation of NMDAR-dependent EPSPs at 20–30 min after TBS (unpaired Student's t test).

