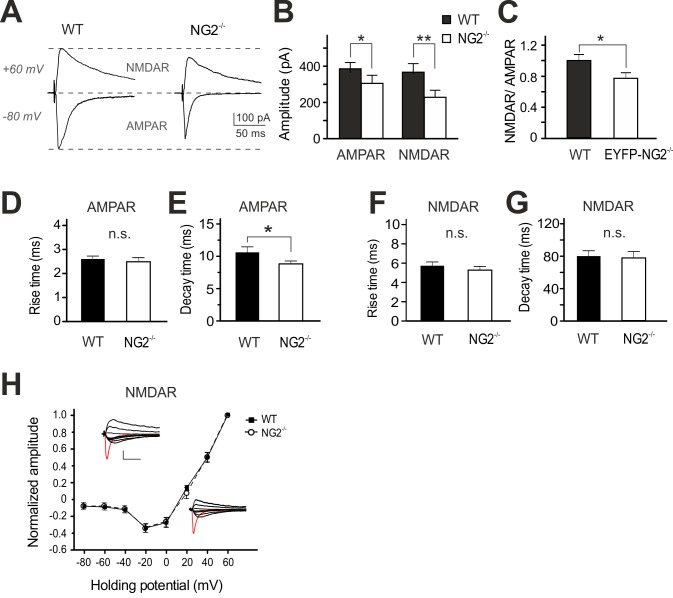
Figure 5. Reduced glutamatergic receptor mediated EPSCs at neuronal synapses of NG2−/− mice.
(A) Example traces show AMPAR-EPSCs and NMDAR-EPSCs detected at a holding potential of −80 and +60 mV, respectively. (B) Summary plot showing average AMPAR- and NMDAR-EPSC amplitudes (unpaired Student's t test). (C) Average ratio of pharmacologically isolated NMDAR- to AMPAR-currents, recorded at holding potential of +60 mV and −80 mV, respectively (unpaired Student's t test). (D–G) Summary plots of rise times (D, F) and decay time constants (E, G) of AMPAR and NMDAR currents (unpaired Student's t test). (H) Current-voltage (I-V) relations of NMDAR currents at L4-to-L2/3 synapses (unpaired Student's t test). In all cases, WT and NG2−/− neurons are compared.

