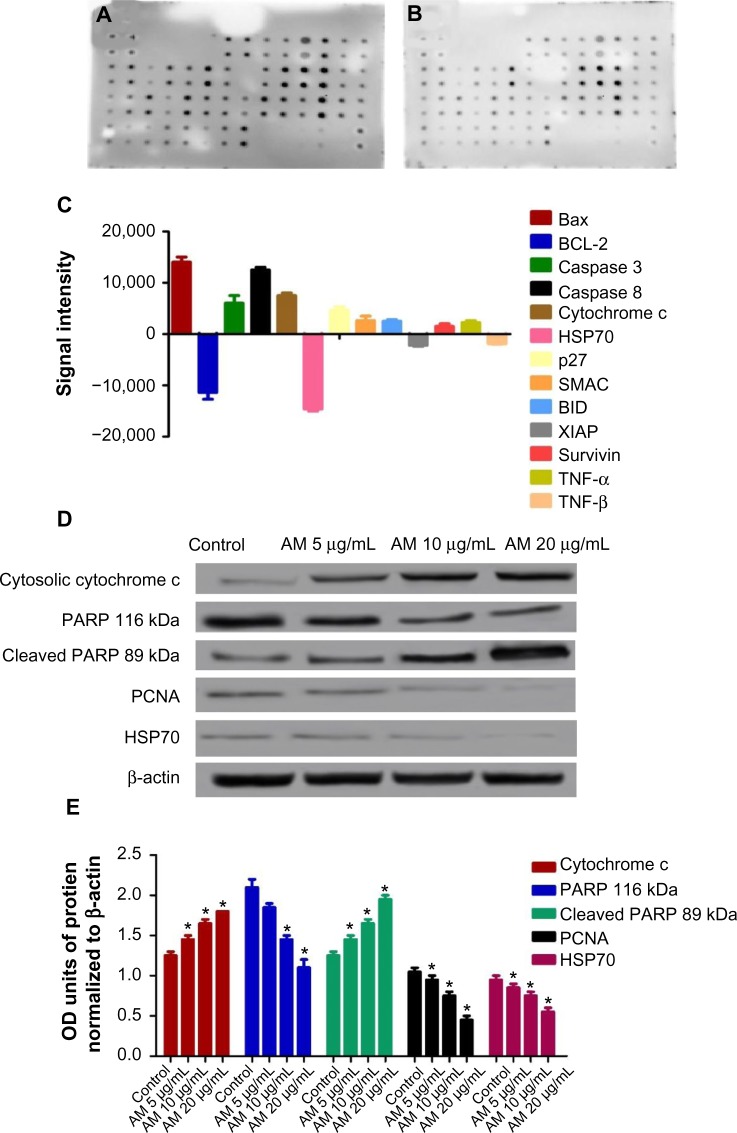
Figure 5.
Screening of the apoptotic markers and proteins expression induced by AM.
Notes: MDA-MB-231 cells were lysed and protein arrays were performed. Cells were treated with 20 μg/mL AM and the whole cell protein was extracted. An equal amount (300 μg) of protein from each sample was used for the assay. Representative images of the apoptotic protein array are shown for the control (A) and treatment (B). Quantitative analysis in the arrays showed differences in the apoptotic markers (C). Immunoblot analysis of cytosolic cytochrome c, cleaved PARP, PCNA, and HSP70 (D). The blot densities of cytosolic cytochrome c, PARP, cleaved PARP, PCNA, and HSP70 are expressed as folds of control. Data are mean ± standard deviation (n=3). *P<0.05 versus control (E).
Abbreviations: AM, α-mangostin; Bax, Bcl-2-associated X protein; Bcl-2, B-cell lymphoma 2; BID, BH3 interacting domain death agonist; HSP70, heat shock protein 70; p27, cyclin-dependent kinase inhibitor 1B; PARP, poly (ADP-ribose) polymerase; PCNA, proliferating cell nuclear antigen; SMAC, second mitochondria-derived activator of caspase; TNF-α, tumor necrosis factor alpha; XIAP, X-linked inhibitor of apoptosis protein; OD, optical density.

