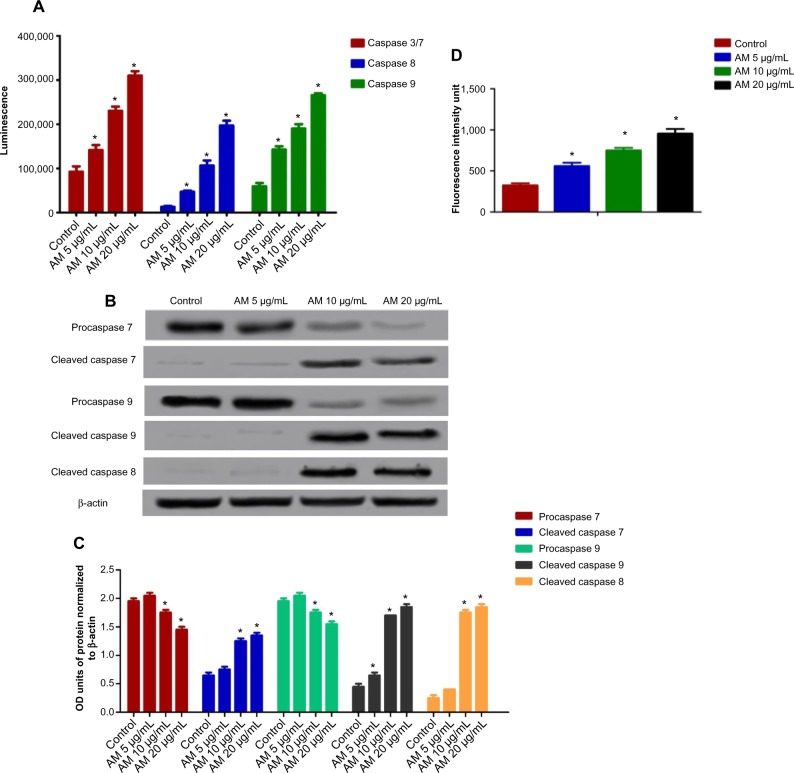
Figure 7.
Effects of AM on MDA-MB-231 cells’ procaspases, caspases, cleaved caspases, and ROS generation.
Notes: (A) Relative luminescence expression of caspases in the MDA-MB-231 cells treated with 5 μg/mL, 10 μg/mL, and 20 μg/mL of AM. (B) Western blot analysis of procaspases and cleaved caspases after treatment with 5 μg/mL, 10 μg/mL, and 20 μg/mL of AM. (C) The blot densities of procaspases and cleaved caspases are expressed as folds of control. Data are mean ± SD (n=3). *P<0.05 versus control. (D) Relative DCF-fluorescence intensity (ROS) at 24 hours after 5, 10, and 20 μg/mL of AM exposure. Values are mean ± SD from three independent experiments. Triplicates of each treatment group were used in each independent experiment. The statistical significance is expressed as *P<0.05.
Abbreviations: AM, α-mangostin; DCF, 2’,7’-dichlorofluorescin; OD, optical density; ROS, reactive oxygen species; SD, standard deviation.

