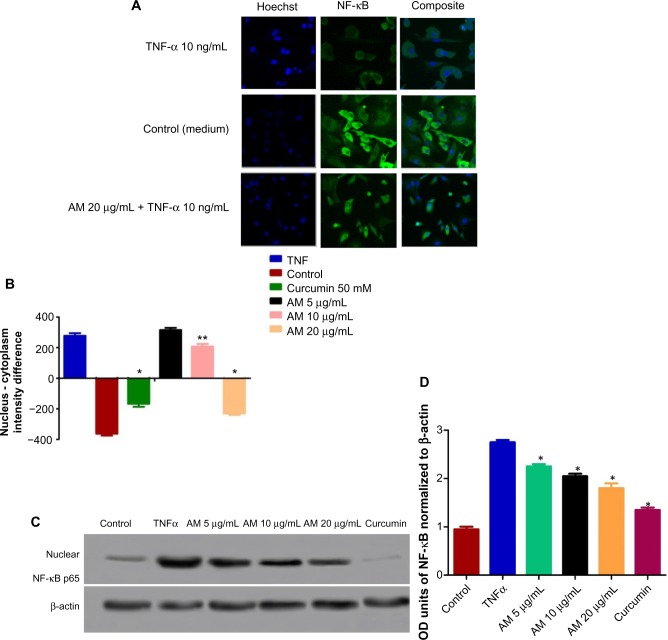
Figure 9.
Inhibition of TNF-α-induced NF-κB nuclear translocation by AM.
Notes: Photographs (A) and dose–response histogram for quantitative image analysis of intracellular targets (B) of stained MDA-MB-231 cells treated with 20 μg/mL AM for 2 hours and then stimulated for 30 minutes with 10 ng/mL TNF-α (NF-κB activation). Triplicates of each treatment group were used in each independent experiment. The statistical significance is expressed as *P<0.05, **P<0.01. (C) Immunoblot analysis of nuclear NF-κB p65. (D) The blot densities of nuclear NF-κB p65 are expressed as folds of control. Data are mean ± standard deviation (n=3). *P<0.05 versus control.
Abbreviations: AM, α-mangostin; NF-κB, nuclear factor-kappa B; ng, nanogram; OD, optical density; TNF-α, tumor necrosis factor alpha.

