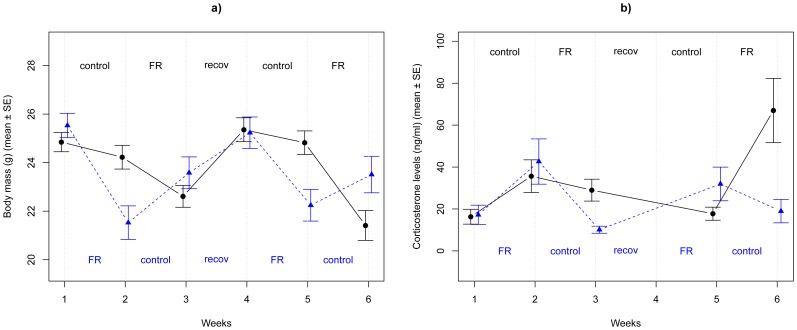
Figure 2. Mean ± SE (a) body mass (b) corticosterone levels during the experiment.
Birds received either a food restricted ('FR') or a control diet, which corresponded to 60% or 110% of their daily food consumption, respectively. During the third week of the experiment, all birds received ad libitum food for one week ('recov'). Birds were randomly allocated into two groups that differed only in the order of the treatments. Black dots and solid lines represent birds starting with the control diet (treatments indicated above the lines), blue triangles and dotted lines represent birds starting with the food restricted diet (treatments indicated below the lines). Note that blood samples were not collected after the recovery period (after week 3), but body mass was recorded.

